Surprisingly About Average
By Russell Russ
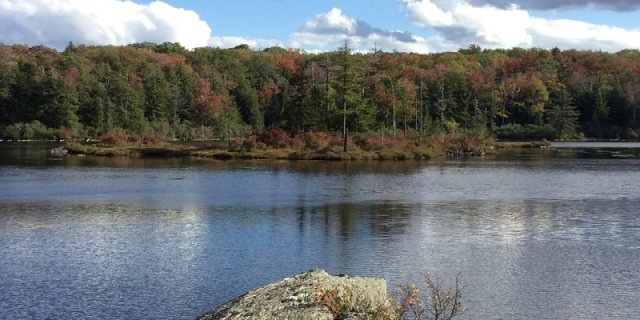
September temperatures were about normal throughout the month. It even felt seasonably chilly by the end of the second week. Autumn was finally arriving. Precipitation for most of the month was well below normal and Norfolk was under moderate to near severe drought conditions for all of September. Picking up nearly three inches of rain during the month’s last couple days certainly helped reduce the rainfall deficit, but we are still a long ways off from our normal yearly precipitation amount. Autumn coloring became very noticeable by mid-month and progressed very nicely through month’s end. Perhaps some early coloring was the result of our drought conditions, but for the most part around Norfolk, the coloring was on schedule. Once again, it was hard to complain about the early fall weather around here, except of course for the ongoing rainfall deficit.
September’s high temperature of 80 degrees was observed on September 8 and the low of 33 degrees was observed on September 21. The average mean temperature was 59.9 degrees, 0.9 degree above normal. Norfolk’s warmest September was in 2015 with a mean temperature of 64.7 degrees. The coolest was in 1963 with 53.6 degrees. Temperatures this September were very much normal. There were some reports of a light frost in a few typically cooler low lying locations on September 15, but it was more widespread in many valleys on September 19. The weather station (a higher elevation) and most areas observed their first frost on September 21. This is about normal for this area. Last year the first widespread frost did not occur until October 5.
The month’s rainfall total was 4.67 inches, exactly normal for September (believe it or not). The monthly total was helped greatly by the 2.94 inches of rain that fell on September 29-30. Even with an average (on paper) September for precipitation, the yearly deficit is still a concern. During the month, drought conditions continued to be very noticeable in local streams, ponds and reservoirs, as well as many lawns, gardens and forest trees.
Norfolk’s driest September was in 2014 with just 1.16 inches. The wettest was in 1938 with 13.40 inches, the second wettest was in 2011 with 13.25 inches. Through September this year, the total yearly precipitation amount was 29.18 inches. This was 9.96 inches below normal. Last year through September we were 4.19 inches below normal. Looking back at the records for recent drought years, the year of 2016 ranked as Norfolk’s 3rd driest year on record and 2015 ranked as 8th driest. Through September, the year of 2020 is on pace to likely be one of Norfolk’s top ten driest years.
October’s weather through mid-month was about normal for both temperature and precipitation. By mid-month we had recorded 2.64 inches of rainfall. This will not reverse the deficit by any means, but it seems that the change in seasons may have had an effect on our rainfall prospects. As is typical, foliage once again peaked around October 10-15. Arguably, this autumn was above average for beautiful fall foliage coloring. No wintry precipitation has been recorded yet, but as we inch closer to winter, it is just a matter of time before we see its return.