
PREVIOUS WEATHER REPORTS

November-December 2020
November & December Weather & a Yearly Summary for 2020
By Russell Russ
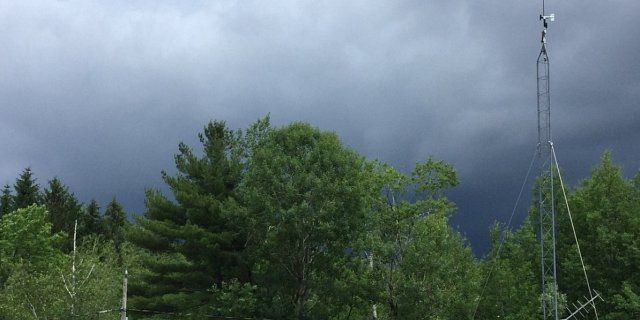
The final two months of 2020 began our journey into winter. November, being warmer than normal with below average precipitation and snowfall, might possibly indicate that we are in for a warm winter with below normal snowfall amounts. December’s conditions were fairly normal for December. There was some snow, it was relatively cold and most small ponds were iced-over and the larger ponds and lakes were getting close to being iced. But, normal was not the norm for most other months during the 2020 calendar year.
November’s average temperature of 41.7 degrees was 4.7 degrees above normal. It was the 6th warmest November on record. Temperatures ranged from a high of 71 to a low of 16 degrees. New daily high temperature records were set on November 8, 9 and 10 and there were near-record setting temperatures on November 6, 7, 11 and 30. These warm days obviously helped with the month’s high ranking for warmth. Precipitation for the month totaled 3.69 inches, 0.90 inch below normal. The monthly snowfall total of 1.1 inches was 5.5 inches below normal. The warmest November on record was in 2006 with a monthly average temperature of 43.2 degrees. After November, with one month to go until year’s end, 2020 at that time was ranked as being the 2nd driest year and 2nd least snowy year.
December’s average temperature of 29.5 degrees was 3.8 degrees above normal, ranking it as Norfolk’s 13th warmest December on record. Temperatures in December ranged from a high of 58 to a low of 6 degrees. The 58 recorded on December 25 (Christmas) tied the 2015 daily record high for that date. With a monthly total precipitation amount of 7.15 inches, it was 2.61 inches above normal. It was Norfolk’s 7th wettest December on record and was by far the wettest month of 2020. The year’s largest storm rainfall total came on December 24-25 when 2.60 inches was recorded. On the morning of December 24 there was 7 inches of snow on the ground, the next morning there was none. Norfolk did not have a white Christmas. December’s monthly snowfall total of 18.4 inches was 1.6 inches above normal. Of the month’s thirty-one days, there were fifteen days when some form of wintry precipitation was observed. During the month, it was cold enough and there was frequent wintery precipitation, but there was just one snowstorm. Norfolk’s largest snowstorm of 2020 occurred December 16-17 when a total of 13.7 inches was recorded. Norfolk warmest December was in 2015 with 39.5 degrees, the wettest was in 1948 with 12.78 inches.
It was an interesting year weather-wise, with arguably four main weather themes that one could say highlighted the year. One was the lack of snowfall during the January through March winter months. After just three months into the year, Norfolk was already nearly three feet below normal for snowfall. Monthly snowfall for the remaining months of the year was more normal, but the damage was done early. The yearly snowfall amount of 55.2 inches was 34.3 inches below normal, ranking 2020 as the 7th least snowy year on record.
The drought conditions experienced for much of the year was another story making headlines. Through June, Norfolk was nearly eight inches below normal for precipitation and much of Connecticut was under some form of drought condition. Conditions improved after August, but a sizable deficit continued through the end of the year, peaking after November at 10.12 inches. One positive that occurred in 2020, likely due to our deficit and fall weather conditions, was that the fall foliage coloring this year was one of the best in recent memory. With a total precipitation amount of 45.11 inches, 7.51 inches below normal, the year ended up being the 18th driest on record.
The warm temperatures recorded throughout the year were also noteworthy. Ten of the year’s twelve months were above normal for temperature and seven ranked in the top 10 for warmest. July was the warmest month of any month on record for Norfolk. The year’s average temperature of 48.0 degrees was 3.1 degrees above normal, ranking it as Norfolk’s 4th warmest year over the last 89 years. The average yearly temperature for Norfolk is 44.9 degrees. The year of 2012 with 48.5 was Norfolk’s warmest year, 1940 with 41.9 was the coldest. Overall, 2020 was a warm year with many warm days, but there were just two days that hit 90 or above for highs. This is average for Norfolk. There were just seven days with single digit low temperatures, just one day with a low of zero and no days with below zero temperatures. This is unusual for Norfolk.
The most notable storm event of 2020 was when Tropical Storm Isaias came through the Northeast on August 4. Most of the heavy rainfall occurred to our west in New York and Pennsylvania, Norfolk only recorded 1.36 inches of rainfall, but there was widespread wind damage throughout Connecticut, most of which was in the western part of the state. Trees and wires were down in many locations and many people were without power for days. Just two days before Isaias hit town there was a small tornado that touched down in North Norfolk. It was a relatively small tornado, one of several that spawned from one small, but strong storm cell that traveled from the Sharon area into Massachusetts. This tornado event got an incredible amount of attention from Connecticut’s TV meteorologists. Tornado warnings with radar maps being zoomed in over local Norfolk roads and landmarks does not happen too often. It was not a large event, but it did result in some tree, branch and powerline damage and even a small blowdown of multiple trees near the western shore of Wood Creek Pond. It was a very busy first week of August for Norfolk’s emergency responders.
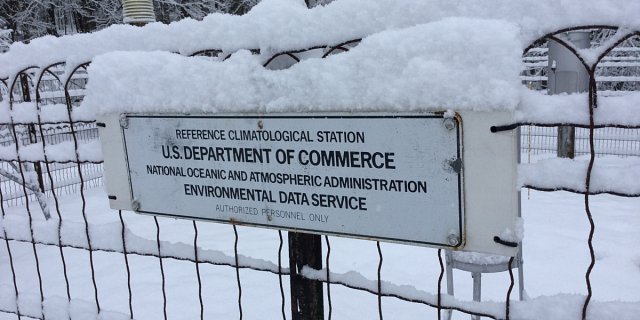
The year of 2021 will be the 90th year of continuous daily weather observing at the Norfolk 2SW weather station. Everyone hopes that 2021 will be a much better year than 2020. Let us hope it will also be better when it comes to the weather. Weather observations and record keeping are performed by Russell Russ for the Great Mountain Forest at Norfolk’s National Weather Service Cooperative Weather Observer Station, Norfolk 2SW.

October 2020
4th Snowiest October on Record
By Russell Russ
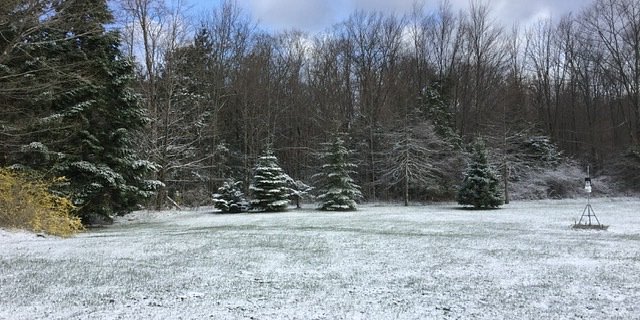
It was a warm, pleasant and colorful October in Norfolk – until the end of the month. On October 30, this month became Norfolk’s fourth snowiest October over the last 89 years. After a long warm and dry fall it was quite a shock for many to see everything covered in new white snow. Much of the state saw some snow, up to two inches in many locations. In the northwest and northeast hill towns there were reports of over four inches. Our growing tradition of some sort of storm rolling in around Halloween held true again in 2020. The fall foliage season, a nice one just like last year, began in September and peaked as usual around October 8-12. By the end of the month most trees were mostly bare except for a few species, most notably the oaks and Norway maples.
The month’s high temperature of 72 degrees was observed on October 22. The low temperature of 21 degrees was observed on October 31. By the last couple of days of the month, with snow on the ground and on the trees, a skim of ice forming on some small ponds and temperatures in the low twenties, it felt like winter was upon us. The monthly mean temperature of 49.4 degrees was 1.6 degrees above normal, ranking it tied with 1998 as Norfolk’s 20th warmest October over the last 89 years. Norfolk’s warmest October was in 2001 with 55.3 degrees. The coldest was in 1974 with an average temperature of 42.0 degrees.
The total precipitation for the month was 5.09 inches, 0.74 inch above normal. It was the first month of the year with a monthly precipitation total that was more than just a little above normal. Norfolk’s wettest October occurred in 1955 with 17.28 inches (also second wettest of any month). The driest October was in 1963 with just 0.63 inch (also the third driest of any month).
The total snowfall for the month was 4.6 inches, ranking it as Norfolk’s fourth snowiest October. The 4.6 inch snowfall on October 30 also ranks it tied with a snowstorm on April 17-18 as Norfolk’s second largest snowstorm of 2020. Through October, our largest snowstorm of 2020 was the 6.1 inches that fell on March 23. The months of January and February measured some snow, but they lacked any significant snowstorms. The average snowfall for October is 0.9 inch. Norfolk’s snowiest October (by far) was 2011’s 23.8 inches.
Through October, the total precipitation amount for the year was 34.27 inches. Even with October’s surplus we still are 9.22 inches below normal for the year. There still are two months to go in 2020, but it is looking like it could be a top ten dry year this year. Currently through October, 2020 ranks as Norfolk’s second driest year behind 1965’s year total of 33.89 inches. The year of 2020 is also lacking in snowfall. With just 35.7 inches of snowfall through October, this year is currently ranked as the second least snowy year behind 1998’s 33.0 inches. Unless the snow really flies in November and December we could be looking at a top five least snowy year.
It has been stated that November can sometimes predict what type of winter we will have. The first few days of November were cold with snow, then there were several days with record and near record warmth, then by the middle of the month it turned very cold. It seems to be anyone’s guess what the winter, let alone November, will be like. New England weather is very interesting to say the least.

September 2020
Surprisingly About Average
By Russell Russ
September temperatures were about normal throughout the month. It even felt seasonably chilly by the end of the second week. Autumn was finally arriving. Precipitation for most of the month was well below normal and Norfolk was under moderate to near severe drought conditions for all of September. Picking up nearly three inches of rain during the month’s last couple days certainly helped reduce the rainfall deficit, but we are still a long ways off from our normal yearly precipitation amount. Autumn coloring became very noticeable by mid-month and progressed very nicely through month’s end. Perhaps some early coloring was the result of our drought conditions, but for the most part around Norfolk, the coloring was on schedule. Once again, it was hard to complain about the early fall weather around here, except of course for the ongoing rainfall deficit.
September’s high temperature of 80 degrees was observed on September 8 and the low of 33 degrees was observed on September 21. The average mean temperature was 59.9 degrees, 0.9 degree above normal. Norfolk’s warmest September was in 2015 with a mean temperature of 64.7 degrees. The coolest was in 1963 with 53.6 degrees. Temperatures this September were very much normal. There were some reports of a light frost in a few typically cooler low lying locations on September 15, but it was more widespread in many valleys on September 19. The weather station (a higher elevation) and most areas observed their first frost on September 21. This is about normal for this area. Last year the first widespread frost did not occur until October 5.
The month’s rainfall total was 4.67 inches, exactly normal for September (believe it or not). The monthly total was helped greatly by the 2.94 inches of rain that fell on September 29-30. Even with an average (on paper) September for precipitation, the yearly deficit is still a concern. During the month, drought conditions continued to be very noticeable in local streams, ponds and reservoirs, as well as many lawns, gardens and forest trees.
Norfolk’s driest September was in 2014 with just 1.16 inches. The wettest was in 1938 with 13.40 inches, the second wettest was in 2011 with 13.25 inches. Through September this year, the total yearly precipitation amount was 29.18 inches. This was 9.96 inches below normal. Last year through September we were 4.19 inches below normal. Looking back at the records for recent drought years, the year of 2016 ranked as Norfolk’s 3rd driest year on record and 2015 ranked as 8th driest. Through September, the year of 2020 is on pace to likely be one of Norfolk’s top ten driest years.
October’s weather through mid-month was about normal for both temperature and precipitation. By mid-month we had recorded 2.64 inches of rainfall. This will not reverse the deficit by any means, but it seems that the change in seasons may have had an effect on our rainfall prospects. As is typical, foliage once again peaked around October 10-15. Arguably, this autumn was above average for beautiful fall foliage coloring. No wintry precipitation has been recorded yet, but as we inch closer to winter, it is just a matter of time before we see its return.

August 2020
Warm and Dry Once Again
By Russell Russ
August’s weather for Norfolk was highlighted by a couple of severe events during the first four days of the month. A small tornado went through North Norfolk on August 2, causing some tree and powerline damage. It was a localized event caused by one small, but strong, storm cell that produced several small tornados that afternoon. There was no rain or wind at the weather station that day. Then, on August 4, Norfolk saw effects from Tropical Storm Isaias. The weather station recorded 1.16 inches from this storm. The big problem with Isaias was the 40 to 50+ mph wind gusts which caused widespread and substantial tree and powerline damage all throughout the state. Power was out for several days in many locations. After these early days of wild weather, August settled down to be a rather pleasant weather month. Our dry spell continued and drought conditions have become an issue in Norfolk as well as many regions of the Northeast.
August’s high temperature of 87 degrees was observed on August 11 and the low of 48 was observed on August 31. The high temperature of 86 on August 23 was a new record for that date, surpassing the 85 from 1943. The monthly mean temperature of 69.1 degrees was 2.7 degrees above normal, our third month in a row with above normal temperatures. This August was tied with August 1938 as Norfolk’s eighth warmest August over the last 89 years. Norfolk’s warmest August on record was in 2001 with a temperature of 71.0 degrees. The coolest August on record was in 1964 with 61.5 degrees.
The total precipitation recorded for the month was 3.56 inches, 1.06 inches below normal. This was below normal, but not near any records for lack of August precipitation. Norfolk’s driest August was in 1953 with just 0.65 inch, it was also Norfolk’s fifth driest month of any month. Norfolk’s wettest August and wettest month of any month was in 1955 with 23.67 inches. The Flood of ’55 occurred in August 1955, making that month’s total precipitation a real record setter. Coming in second wettest for August was 2011 with a more realistic and less off the charts total of 13.36 inches. The month of August can have big swings for precipitation amounts here in Norfolk. Hurricanes obviously play a large role in this.
Through August, the total precipitation amount for the year was 24.51 inches. This was 9.96 inches below normal and also 7.60 inches less than last year’s total through August. The year of 2020 has been a very dry one and if substantial precipitation does not come during the year’s final quarter, then it could rank as one of Norfolk’s driest years on record. Many areas in the Northeast are seeing similar drought conditions this year.
Beautiful weather continued to bless Norfolk during the first three weeks of September. Temperatures were seasonable and about normal for September, but rainfall continued to be below normal. It has been an active hurricane season in the Atlantic, with the Gulf Coast seeing numerous landfalls, but Connecticut has seen little in the way of tropical storms or hurricanes this year. With our dry conditions, many are hoping for a tropical storm or hurricane. Be careful what you hope for sometimes. We need rain, but we do not need it all at once. As is usually the case, Norfolk’s fall foliage season started in late August to early September. Peak coloring is usually around October 12, but the dry conditions this year may play a role and also may change the timing of our fall coloring. Fall is one of the finest seasons in Norfolk so get out and enjoy the beautiful weather and foliage while it lasts.
July 2020
Warmest Month on Record
By Russell Russ
Historically, July is Norfolk’s warmest month of the year. It is the summer season and it is supposed to be warm during summer, but July 2020 was something special. According to NOAA, for many states in the Northeast, the South and the East it was either the warmest month on record or at least in their top-10 for warmest. For the Norfolk 2SW weather station it was the warmest month ever recorded since observations began in 1932. NOAA also stated that across the country July was above average, if not very high ranking, for precipitation. Norfolk certainly did not fall into that category. Norfolk recorded another below average month for precipitation and its yearly precipitation deficit continued to grow.
July’s low temperature of 57 degrees was observed on July 2 and the high of 93 degrees was observed on July 19. The July 19 temperature of 93 was a new daily record for that date, beating the 92 recorded in 1991. The high of 89 on July 27 tied the 1955 record for that date. Even though there were not many record setting days for high temperature, the monthly average was still very high. There were many days in 82 to 88 degree range and many nights that did not dip down to more normal July overnight temperatures. The end result was Norfolk’s warmest month on record.
July’s average monthly mean temperature of 73.1 degrees was 4.9 degrees warmer than normal. Norfolk’s warmest months of July (and of any month) on record are now July 2020 with 73.1, July 2013 with 72.7 and July 1955 with 72.1. July 2019 ranks fourth with 71.9 degrees. Norfolk’s coolest July occurred in 1962 with a monthly mean temperature of 63.9 degrees. The second coolest July was in 2000 with 64.4 degrees.
The total precipitation recorded for the month was 3.17 inches, 1.17 inches below normal. Below normal, but not even in the top-20 for being a dry July. Comparatively it was not all that dry, but it was just another lack of a drop in the bucket so to speak. Norfolk was already working with a sizable precipitation deficit after June. Other parts of Connecticut and the Northeast are seeing similar conditions. There are, however, some areas in the Northeast that have seen more rainfall and are less worried about drought conditions. Through July, Norfolk was 8.90 inches below normal for the year. Norfolk’s wettest July was in 2014 with 12.76 inches, the driest was 1939 with 1.29 inches.
Norfolk’s August weather, through two-thirds of the month, was highlighted by two big weather events that hit during the first week of the month. A small tornado touched down in North Norfolk on August 2. The tornado in town was actually from one fairly small storm cell that had several touch down points spanning from Sharon to Tolland, MA. There was damage to some property and many trees blew down at the touch down points, but damage was not widespread. For widespread damage we only had to wait until August 4 when Norfolk was hit with effects from a tropical storm. Most of the heavy rainfall from this storm went just to the west of Connecticut. Norfolk recorded 1.16 inches of rainfall, a manageable amount. The big weather story from this storm for Norfolk and many locations throughout the state was the relatively high winds associated with the storm. There was extensive tree and powerline damage all across the state, perhaps the worst was in western and northwestern Connecticut. Power was out for several days (or more) in many locations. Needless to say at this point, Norfolk’s fine emergency personnel and many utility companies were very, very busy in town for many days and nights and many homeowners and businesses had to deal with a long duration power outage.

June 2020
Warm and Dry
By Russell Russ
June was a fairly pleasant summer month. The trade-off with having such beautiful weather is that it can become very dry with such little rainfall. While many other parts of the region did record decent rainfall, and some impressive rainfall, Norfolk kept being missed by the larger storms. On numerous occasions the storms either fell apart just before hitting town or just missed town on their way through the state. Lawns turning brown and brooks becoming nearly bone dry by mid-June is not a good sign. Hopefully, later in the summer, the storms will find Norfolk and provide some relief from its growing precipitation deficit.
June’s low temperature of 37 degrees was observed on June 1. A low temperature of 38 degrees on June 14 was a new record low for that date (was 41 in 1933). The month’s high temperature of 90 degrees on June 22 was a new record high for that date (was 88 in 1943). June 22 was Norfolk’s first day this year with a temperature of 90 degrees or above. On average, Norfolk reaches 90 or above just two to three times each year. The average monthly mean temperature this month was 66.0 degrees, 2.6 degrees above normal. This places June 2020 tied with June 1994 as Norfolk’s 9th warmest June over the last 89 years. Norfolk’s warmest June was in 1943 with 68.3 degrees and the coolest was in 1958 with 58.8 degrees.
The total precipitation recorded for the month was just 2.13 inches, 2.71 inches below normal. It was Norfolk’s 11th driest June over the last 89 years. The driest June was in 1988 when only 0.61 inch was recorded. The wettest June was in 2013 with 13.38 inches. There were two relatively small thunderstorms this month, on June 6 and 29.
For the first half of 2020, Norfolk’s total precipitation amount totaled just 17.78 inches. This was 7.73 inches below normal though the month of June. Let us hope that things turn around and we pick up considerably more rainfall in the coming months. The years of 2016 (3rd driest) and 2015 (8th driest) were recent back to back very dry years. In comparison to those recent highly ranked dry years, through the month of June, 2020 has been drier than both of them. We could be looking at a very high ranking dry year this year. Stay tuned and wish for rain.
An early look at July through July 24 showed that summer’s heat and humidity really set in. While July is historically our warmest month of the year, this July so far was much warmer than usual. With just a week to go until the end of the month, July stood at just 0.1 degree away from being the warmest July, and also the warmest month of ANY month, over the last 89 years. In recording an impressive 93 degrees on July 19, Norfolk topped the 90 degree mark for the second time this year. We finally did get some much needed rainfall with a few days of stormy weather, complete with a couple of good thunderstorms. We were still about an inch below normal for the month, but at least some rain has found its way into town and we won’t be recording another high ranking dry month.
May 2020
A Tale of Two Halves
By Russell Russ
Norfolk’s May weather this year can be summed up as being a month with a split personality. The first half of May was cold with some snow. April’s cooler than normal weather spilled over into early May. The second half of the month turned much more seasonable with warm temperatures and sunny skies. On paper, the month’s final totals and averages almost averaged-out, but that is just on paper. It was a strange month for weather, but it did launch us all into summer.
May’s low temperature of 26 degrees was observed on May 9 and the high of 83 degrees was observed on May 26. With an average monthly mean temperature of 54.1 degrees, it was 0.8 degree below normal. After experiencing the first half of this May it is hard to believe that in the end, last May actually ended up being colder. Norfolk’s warmest May occurred in 2015 with a temperature of 61.8 degrees, the coldest was in 1967 with 46.8.
The total precipitation recorded for the month was 2.66 inches, 1.69 inches below normal. Through May, the total precipitation for 2020 was 15.65 inches. Through the end of May, Norfolk was looking at a yearly deficit of 5.02 inches. A big difference from last year when Norfolk was looking at a precipitation surplus of 2.14 inches through May. Norfolk’s wettest May was in 1984 with 12.34 inches, the driest was in 1980 with 1.31 inches.
May’s snowfall total of 1.0 inch was 0.6 inch above normal. It was not much snow, but it was enough to rank this May as tied with 1978 as Norfolk’s fifth snowiest May over the last 89 years. Norfolk’s 2020 snowfall total through May was just 31.1 inches, 34.1 inches below normal. Norfolk’s (and Connecticut’s) snowiest May on record was in 1977 when an amazing 20.0 inches was recorded. Our 2nd snowiest May was in 1945 with 5.6 inches.
It is hard to believe, but wintery precipitation is fairly common in Norfolk in May. Over the last 89 months of May, Norfolk has recorded some form of snow or sleet during 42 of those months. There have been 13 Mays with measurable amounts (0.1 inch or more) of wintery precipitation and 29 Mays that have recorded a trace amount. In Norfolk, spring does finally arrive, but winter usually throws in a few last minute surprises.
The Winter Season officially ended after May and this season’s (October-May) snowfall total was 57.1 inches, 32.4 inches below normal. The 2019-2020 Winter Season snowfall was the 12th least amount on record. Last winter ranked 11th least. Not a good two year span for snow lovers or those that make a living from snow.
An early look at June’s weather through mid-month shows that temperatures were about normal, but precipitation was way below normal. The first half of June had some beautiful weather, but rain is needed in this region. Lawns turning brown by mid-June is not a good sign. At some point we will need to trade off some beautiful sunny weather for some rain.
April 2020
No Springtime Yet
By Russell Russ
April can have traits of both winter and spring. It is historically a month of transition between the two seasons. This year, much to the dismay of many, April was more like winter than spring. Winter indeed was giving a good effort to hold on as long as it could.
April’s low temperature of 26 degrees was observed on April 12, 17 and 22. The high of 62 degrees was observed on April 25. With an average monthly mean temperature of 40.8 degrees, it was 2.3 degrees below normal. It was about five degrees colder than last April. There were no record daily highs or lows this month and overall the entire month only came in as the 20th coldest April over the last 89 years. On paper it was fairly normal temperature-wise, it just felt cold. Norfolk’s warmest April was in 2010 with an average mean temperature of 49.4 degrees and the coldest was in 1943 with 36.8 degrees.
The total precipitation recorded for the month was 4.38 inches, just 0.12 inches above normal. It did not happen by much, but it was the first month of 2020 that came in above normal for precipitation. Through April, the total precipitation for the year was 12.99 inches, 3.33 inches below normal. This is nearly five inches less than through April last year.
April’s snowfall total was 6.5 inches, 0.6 inches above normal. Surprisingly, although it seemed so snowy this month, it really was near normal. Snowfall in April is common in Norfolk. Snow does not stick around very long in April. This year, of the thirty days in April, five days had a trace of snow on the ground and only two days had measurable snow on the ground.
Through April, the 2020 calendar year snowfall amount of 30.1 inches was 34.7 inches below normal. This is about five inches less than through April last year. The Norfolk record for most snowfall during the month of April was 27.7 inches in 1956.
The 2019-20 winter season (October-April) snowfall total of 56.1 inches is currently 33.0 inches below normal for the season. This is only 0.5 inch less than last season through April. Nearly the same snowfall for two years in a row, but still considerably below normal for both. The winter snow season ends after May so the seasonal totals are not finished yet. Yes, Norfolk can see snowfall in May.
A look ahead at May’s weather through mid-month shows that temperatures were running 8.7 degrees colder than normal. In fact, through May 15, this May was standing as the coldest May on record over the last 89 years. That will likely change as the second half of the month progresses, but it still likely will rank quite high as a cold May. Winter was still trying to hang on.
Rainfall was about normal, but snowfall was above normal. Yes, Norfolk can see snowfall in May. Between May 8 and May 9 Norfolk recorded a total of 1.0 inch of snowfall. The average for May is just 0.4 inch. This year’s May measurable snowfall occurred on the anniversary of the great May snowfall of 1977 when a state record 20.0 inches was recorded. The forecast for the second half of May is looking warmer and brighter. Maybe spring will finally arrive in Norfolk after all.

March 2020
Another Warmer Than Normal Month
By Russell Russ
March was warmer than normal, just like January and February were. What happened to winter in this part of the world? For most of this winter there has been little snow, frequent days with above average temperatures and no real cold temperatures. By late February many people had given up on any chance for winter weather and by the middle of March everyone had given up. With winter being a no show, it must mean spring is just around the corner. By early March it felt like spring was already here. Spring had other thoughts and with everyone focused on COVID-19 the warm and sunny spring weather that seemed eminent just never materialized. Norfolk’s late March weather was more like normal late March weather.
Figuring pond ice in and out dates this winter proved to be very frustrating. Generally speaking, the smaller ponds iced over by December 1 and went out by March 4 and generally stayed ice covered for the duration. The local larger bodies of water, like Tobey Pond and Wangum Lake, began icing over December 5, but never fully iced for good until about January 21. Both Tobey and Wangum were mostly ice free by March 8, about two weeks earlier than normal. Much to the dismay of fans of ice skating and ice fishing, it was a short pond ice season, but it was not all that surprising based on the above average temperatures all winter.
March’s low temperature of 12 degrees was observed on March 1 and the high of 65 degrees was observed on March 9. With an average monthly mean temperature of 36.1 degrees, it was 5.4 degrees above normal. This March was the tenth warmest March over the last 89 years. Norfolk’s warmest March was in 2012 with 41.8 degrees, the coldest was 1960 with 21.2 degrees.
The total precipitation recorded for the month was 3.36 inches. This was 1.02 inches below normal. Not record worthy, but it is the third month in a row in 2020 that has been below normal for total precipitation. Norfolk’s driest March was in 1981 with 0.64 inch, the wettest was 1953 with 10.37 inches. Through the first quarter of 2020 the total precipitation amount was 8.61 inches, 3.45 inches below normal. A deficit is slowly growing.
The lack of significant and lasting snowfall continued to be one of the main weather themes for the month, and for this winter for that matter. March’s snowfall total of 9.3 inches was 8.5 inches below normal. As of March 22 with just 2.4 inches of snowfall it would have been the sixth least amount on record for March, but with an additional 6.9 inches recorded by March 31, it ended up being just the nineteenth least amount for March over the last 89 years. Norfolk’s snowiest March (and snowiest of any month) was in 1956 with 73.6 inches. March 1946 with a total monthly snowfall of just 0.5 inch holds the record for least amount.
Through the first quarter of 2020, the total snowfall amount was just 23.6 inches. This was 35.3 inches below normal. Yes, that is nearly three feet below normal in just three months. The 2019-2020 winter season (October-March) snowfall total through March was 49.6 inches. This was 33.6 inches below normal. Without December’s good effort of 20.8 inches of snowfall, which was 4.0 inches above normal, then this winter would really be near the top of the list for least snowfall for a winter season. As it is, through March, this winter is sitting as the eighth least snowy winter season over the last 89 years.
April and May still count towards winter snowfall totals and with April’s weather acting more like March or even February, it seems that instead of a no show, this winter is trying to be a late bloomer. At this late point in the season, most people likely feel that this is just downright depressing. Mother Nature can be annoying sometimes.
Through two-thirds of the month, April was running 2.6 degrees below normal for temperatures, about normal for total precipitation and interestingly 0.6 inch above normal for snowfall. The 4.6 inches of snow that fell on April 17-18 was unusual, even for Norfolk, but it was not unheard of for Norfolk and certainly no record for Norfolk. The snow squall that blew through town with a strong cold front during the afternoon of April 21 was quite a surprise, but even that 1.1 inch snow burst was not record setting. The temperature drop of 11 degrees in twenty minutes that afternoon was just amazing. Mother Nature can be amazing sometimes. The outlook for late April and early May appears to be cool with more chances for a little snow. Spring-like weather will come, it is only a matter of time.

February 2020
7th Warmest February on Record
By Russell Russ
The typical winter weather that Norfolk has historically become accustomed to continued to stay away during the month of February. There were brief glimpses of winter with some cold temperatures and a little snow, but for the most part, it was a very unusual February as far as the weather is concerned. As they have been doing all winter, the weather patterns that often bring cold temperatures and snow into this part of the country have been pushed elsewhere – or haven’t formed at all. The northern regions of New England and New York State have seen something that resembles snow and winter, but not southern New England. Winter seems to have taken the year off in Norfolk.
The month’s low temperature of 0 degrees was observed on February 15. There were only two days this month with single digit temperatures. The high temperature of 55 degrees was observed on February 24. There were no daily record high or low temperatures this month. The average monthly mean temperature was 28.6 degrees, 6.5 degrees above normal. It was the seventh warmest February over the last 89 years. The warmest February on record was in 2002 with 30.7 degrees. The coldest was in 1934 with 9.0 degrees, making that also the coldest month of any month as recorded at this weather station.
Total precipitation recorded for the month was 3.38 inches, 0.26 inch below normal. The 2020 calendar year, January and February, total precipitation amount of 5.25 inches was 2.43 inches below normal. Monthly total precipitation amounts in Norfolk are evenly distributed throughout the year, with average monthly amounts ranging from 3.64 inches to 4.84 inches. February happens to be the month with, on average, the least amount of precipitation here in Norfolk. The record for most February total precipitation is 11.70 inches from 1981, the least amount is 0.60 inch from 1987.
February’s monthly snowfall total of 8.5 inches was 11.9 inches below normal. This month ranked as Norfolk’s seventh least snowy February over the last 89 years. The record for least snowfall in February is 4.8 inches from 1998, the most is 52.4 inches from 1969. Norfolk has seen precipitation this winter, but most of it has been plain rain or sometimes sleet or freezing rain. When Norfolk has seen snow, it often has been preceded or followed by sleet, freezing rain or rain. Norfolk usually stays all snow when other parts of the state get rain or a mix, but that has not been the case for a better part of this winter.
The 2020 calendar year snowfall total through February was just 14.3 inches. This was 26.8 inches below normal. That is quite a snowfall deficit for just two months. The snowfall total for this winter season, October through February, was 40.3 inches. This was 25.1 inches below normal for this time period. Bad news for the snow lovers and those who make a living from snowfall. To make things even more unpleasant for these people is the fact that the winter season snowfall total through February last year was just 44.0 inches. Better than this winter, but not by much. The 2018-2019 winter season ended up with 56.6 inches of snowfall, ranking it as the eleventh least on record.
A look ahead into March through mid-month shows that typical winter weather continues to be a no show. March’s monthly temperature was running 6 degrees above normal. Both total precipitation and snowfall were well below normal for March. Norfolk once again is flirting with a very high-ranking low snowfall winter. Unless something really snowy comes our way between late March and May, this winter could easily rank in the top ten for least winter snowfall for Norfolk.
