
PREVIOUS WEATHER REPORTS
December 2015
Norfolk’s November & December Weather & a Yearly Summary for 2015
By Russell Russ
Unusual Weather to Finish the Year. The closing months of 2015 brought warm weather and below average amounts of rain and snow. Actually, very warm and very snowless. Unusual for Norfolk, but for 2015 it seemed to be a fitting end to a strange weather year. Numerous months throughout the year ranked high in several categories. Warm temperatures, rainfall deficits and snowfall deficits immediately come to mind, but there were also cold temperatures and snowfall amounts that ranked high in the record books as well. The end of 2015 marks the completion of eighty-four continuous years of daily weather observations at the Norfolk 2SW weather station. This past year will certainly be remembered as being one of the strangest ones in this station’s history.
November’s average temperature of 42.1 degrees was 5.1 degrees above normal and was tied with 1975 as the fourth warmest November on record. The warmest was 2006 with an average temperature of 43.2 degrees. November’s total precipitation amount of 2.40 inches was 2.24 inches below normal. Not record worthy, but it did increase the yearly deficit. Only a trace of snow was observed, 6.5 inches below normal, but not all that unusual.
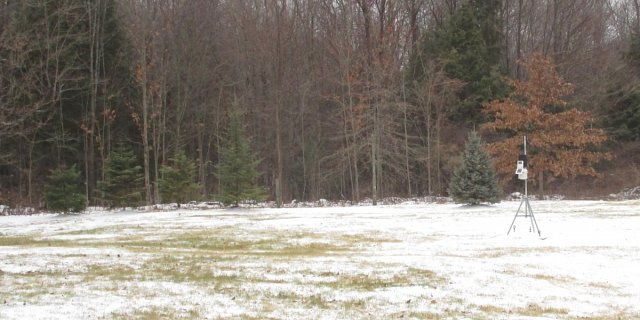
December was off the charts warm. When you can look at a thermometer in Norfolk on both Christmas Eve and Christmas and the temperature is warmer than it was on Independence Day you know something is strange. The July 4 low was 55 degrees, the high was 67. The high on Christmas Eve was 64 and on Christmas was 58. Needless to say, it was not a white Christmas here this year. Daily high temperature records were set on December 15, 17, 24 and 25. December’s average temperature of 39.5 degrees was 14 degrees above normal. It was by far the warmest December on record, beating the previous December 2001 record by 4.4 degrees.
December did see near normal precipitation with 4.10 inches, just 0.44 inch below normal, but that only included 1.5 inches of snowfall (mostly sleet). That 1.5 inches placed this month tied for third lowest snowfall amount for the month of December. Besides being very warm, this month will be remembered as having much more than its fair share of cloudy days and mist and fog.
The year of 2015 will be remembered as being warm and dry, which it certainly ended up being, but it began very cold and snowy. Last winter started off warm then turned much more winter-like after January. We could possibly see this happening again this winter. The 2015 yearly mean temperature of 46.0 degrees was 1.2 degrees warmer than normal, ranking it as tied with 2007 and 2008 as the twelfth warmest year on record. May, September, November and December were very warm, but January, February and March were quite cold. The crazy warm December was negated by the crazy cold February.
The year’s total precipitation amount of 41.57 inches was 11.22 inches below normal. It was the seventh driest year on record. The snowfall amount of 72.7 inches was 17.8 inches below normal, but thanks to the above normal snowfall in January and February it does not rank very high for least amount of snowfall for a year.
October 2015
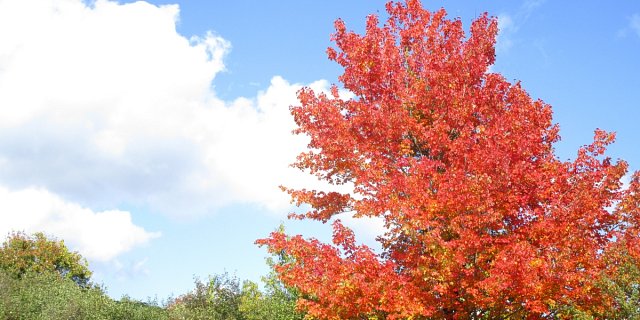
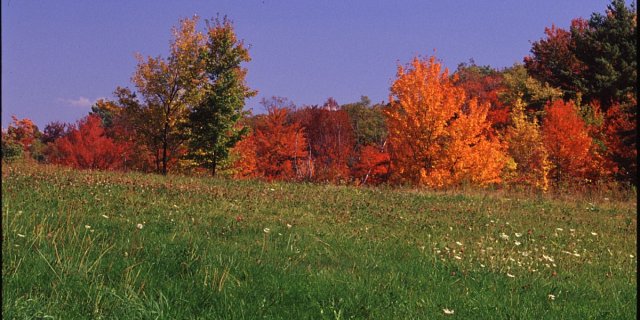
A Beautiful Fall Foliage Season
By Russell Russ
A near typical October for Norfolk. Temperatures were about right for this time of year. Many locations had early morning frost on at least ten days. Even the weather station in its higher elevation saw frost on six mornings. Rainfall continues to be below normal, but we seem to be picking up just enough to keep out of serious drought conditions.
Perhaps the dry conditions helped with our spectacular fall foliage colors this year. The lack of heavy rain (and snow) and wind storms certainly helped the trees keep their leaves on for our visual enjoyment. All fall foliage seasons are beautiful, but this year seemed to be brighter than normal. Peak coloring in Norfolk occurred around Columbus Day this year, as usual earlier than many other parts of the state, but very typical for northwestern Connecticut.
The month’s high temperature of 71 degrees was observed on October 12 and the low temperature of 20 degrees was observed on October 19. Several morning lows dipped into the low to mid 20’s. The average mean temperature was 46.6 degrees, 1.1 degrees below normal. It was 3.7 degrees cooler than last October.
The total precipitation for the month was 3.22 inches, 1.08 inches below normal. Nearly two-thirds of the monthly rain, 2 inches worth, came during a period of less than twenty-four hours spanning October 28 and 29. Had it not been for this one late month rain event we would have been once again flirting with another potentially record setting dry month. The first snow of the season came during the afternoon of October 18. The snow showers resulted in just a trace of measured snow, but the ground was covered and it certainly reminded us all that winter really is just around the corner.
The yearly rainfall deficit continued to grow this month. Through October, the total precipitation amount for the year was 35.07 inches. This is 8.54 inches below normal and 12 inches below last year through October. Unless the weather patterns dramatically change over the next two months 2015 is solidly looking at a spot in the top ten driest years on record for Norfolk.
September 2015
Warmest September on Record
By Russell Russ
Our warm and dry conditions continued throughout most of September. This was a continuation of the weather we have had here since early July. Last September was the driest September on record and this year was the warmest. It was just about set to be the sixth driest September this year until the last day of the month when we finally received a good soaking rain. Perhaps the tide has finally turned and we will turn back to more normal conditions as we move further along into autumn.
September’s high temperature of 89 degrees was observed on September 8, making it the warmest day of 2015. We never reached 90 degrees or above at the weather station this year. The one daily record this month was the 86 degrees recorded on September 7, which tied the previous 2007 record. We came within a couple of degrees of record highs on September 8 and 9.
The low temperature of 36 degrees was observed on September 27. The first frost of the season came on September 27 when there were reports of several low lying areas with a light frost, but there was no frost at the weather station during the month.
The average mean temperature in September was 64.7 degrees, 5.9 degrees above normal. It was the warmest September on record for the Norfolk station. The five warmest Septembers on record for the station’s 84-year history are: 2015 with 64.7, 1961 with 64.6, 2001 with 64.0, 2011 with 63.1 and 2005 with 62.9. In fact, five of the seven warmest have occurred in the last 11 years (since 2005) and seven of our eight warmest have occurred in the last 18 years (since 1998). Seems like Norfolk’s summer season has extended into September, at least for the time being.
The rainfall total for September was 4.00 inches, 0.73 inches below normal. The 2.25 inches that fell the last day of the month helped to bring us closer to normal, but the yearly deficit is still large and actually grew during the month. There were no thunderstorms this month, continuing the trend we have seen all summer long. It was almost the summer with no thunder—very strange.
Through September this year, the total yearly precipitation amount was 31.85 inches, 7.46 inches below normal and almost exactly 10 inches below last year’s total through September. For some perspective on our dry year, our driest year on record was 1965 with 33.89 inches and our tenth driest year was 1943 with 42.53 inches. If our dry trend continues then we could easily be within the top 10 for driest years on record.

August 2015
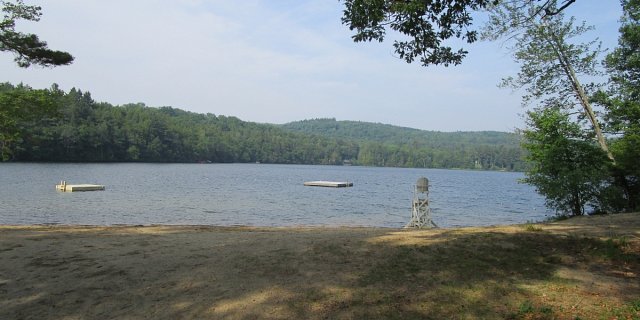
Hard to Complain about the Weather
By Russell Russ
To define great summer weather most people would say warm and sunny. Since July, we have seen much more than our fair share of warm and sunny. Admittedly, the lack of rainfall has been a problem for some, but there have been no huge wildfires in Connecticut, and while we are in drought conditions, it could be worse. Except for a few freak weather events this summer, our Connecticut media personalities seem almost embarrassed that there has been no terrible weather to go on and on about.
The month’s high temperature of 88 degrees was observed on August 18. That was the station’s record high for that date, just beating the old 1935 record of 87. The low of 50 degrees was observed on August 29. The monthly average mean temperature was 68.7 degrees, 2.4 degrees warmer than normal.
August 2015 ties 2012 as our ninth warmest August in the last 84 years. Yes, there were locations in the area that probably hit 90 degrees, but not at the weather station. The station hit a high of 88 just once in July and once in August, so we are below average for the number of days per year that reach 90 degrees or above (typically two to three).
The total precipitation recorded for the month was 1.95 inches, 2.72 inches below normal. It was on the dry side once again, and was our ninth driest August in the last 84 years. There was just one thunderstorm observed at the station this month. The big storms continued to miss Norfolk, which has been the case all summer long. This is a large factor in our low monthly rain totals.
Through August, the total precipitation amount for the year is 27.85 inches. This is 6.73 inches below normal and our largest deficit of the year to date. If this dry weather continues through the fall, we could easily be in the top 10 for driest years on record.
September has continued our stretch of warm and sunny weather. Through two-thirds of the month we are way above average for temperature and nearly three-inches below normal for rainfall. It was 89 degrees on September 8, which made it the warmest day of 2015. One has to think the weather will turn since fall is now upon us. National Oceanic and Atmospheric Administration (NOAA) has predicted this winter will be warmer than normal, but they predicted that for last winter also.

July 2015
Pleasant Summer Weather
By Russell Russ
The month of July can sometimes be a weather record setter for warmth and rainfall. July 2013 was our warmest month on record and July 2014 was our ninth wettest month on record. July 2015 was no record setter. In fact, it was considerably below normal for rainfall and only a little above normal for temperature.
June’s much higher than normal rainfall helped us through a good part of July, but by the end of the month the rainfall deficit was noticeable in the many dry lawns and gardens in the area. There were a couple of heat waves, but a heat wave for Norfolk is not the same as it is for the big cities. We can continue to thank our relatively high elevation and our forested landscape for their cooling effects on our temperatures.
July’s low temperature of 49 degrees was observed on July 3 and 17. The high temperature of 88 degrees was observed on July 29. There were no temperature records set this month. With an average monthly temperature of 68.9 degrees, it was 0.8 degree above normal. The Norfolk weather station on average gets to 90 degrees or above just two to three times a year. We did not reach 90 degrees last year and we have not reached it yet this year either.
The total precipitation recorded for the month was 2.49 inches, 1.79 inches below normal. It was on the dry side, but nowhere near any record for lack of rain. There were three thunderstorms observed this month, but nothing on the severe side. As has been the case all summer, many of the more severe storms are just missing Norfolk.
Through July the total precipitation amount for the year is 25.90 inches. This is about four inches below normal. Currently we do need the rain, but the deficit has not reached a critical level yet and could be erased with just a couple of good summer thunderstorms.
What will August’s weather bring us? Through mid-month we still have not topped the 90 degree mark here at the weather station, although we are running a little above average for temperatures. It’s not the heat, it’s the humidity, and we have seen our fair share of humid weather. Enjoy the summer heat while it is here. Hard to believe, but in just a few weeks the leaves will begin to turn and fall will be upon us.
June 2015
A Cool and Wet Month
By Russell Russ
June was a wet and relatively cool month. May was record setting for warmth and much drier than normal. The two months were on opposite sides of the spectrum. In May we were looking for some rain, any rain, and in June we were looking for a couple of days in a row with no rain. What you saw this month is more than likely not what you saw last month and probably not what you will see next month. That seems to be the way the weather has been going recently. Or, maybe that is what the weather does all the time, it changes.
June began much cooler than normal, downright chilly you could say, then it warmed up to near normal for the remainder of the month. Beautiful sunny days were hard to come by. Rainfall was much higher than normal. If there is a good month/bad month weather pattern, which I doubt, then July will be sunny and pleasant. Mark Twain once said, “If you don’t like the weather in New England now, just wait a few minutes.” Perhaps he came up with that quote while he was staying here in Norfolk for a couple of summers back in the very early 1900’s. Not sure this can be confirmed, but it is a possibility.
June’s low temperature of 39 degrees was observed on June 7 and the high of 83 degrees was observed on June 13 and 24. With an average monthly temperature of 62.3 degrees it was one degree cooler than average and two degrees cooler than last June. As cool as it might have seemed there were no temperature records set this month. Interestingly, June’s average temperature was only 0.5 degree warmer than May’s average temperature. Typically June is 8.6 degrees warmer than May. Of course, this past May was far and away the warmest May on record.
The total precipitation recorded for the month was 9.20 inches, 4.33 inches above normal. There were three thunderstorms observed this month, all occurred on June 23. It was the fifth wettest June over the last 84 years. The top six wettest Junes over the last 84 years: 2013 with 13.38 inches, 1986 with 10.41, 2009 with 9.53, 1972 with 9.22, 2015 with 9.20 and 1937 with 8.73.
For the first half of 2015, January through June, our total precipitation amount was 23.41 inches. Through May our precipitation deficit for the year was 6.55 inches. Through June the deficit was 2.22 inches so we indeed made up some ground in the rain department.
May 2015
Warmest May on Record
By Russell Russ
Last year’s title for the May weather article was Nothing Special, that was not the case this year. We all heard how dry this month was, but what snuck up on many of us, including yours truly, was how warm it really was. This month was the warmest May recorded in our 84 years of weather observing here in Norfolk. Sometimes winter feels like hitting us with one more shot in May, but not this year, not even a hint of a parting winter shot.
Had it not been for a few small thunderstorms on a couple of days then it certainly would have been our driest May on record, like it was for many parts of the state. This is very strange since it was reported that this May was the wettest on record for the continental United States. The rest of the country was very wet while the northeast, including Norfolk, were very dry. It all comes down to location.
May’s high temperature of 85 degrees was observed on May 8 and the low temperature of 36 degrees was observed on May 14 and 23. The 85 on May 8 tied 1936 as the record high for this date. We came close to record highs on a few other days as well. With an average monthly temperature of 61.8 degrees, it was 7.1 degrees above normal, the warmest May in the last 84 years and the first time May’s average monthly temperature broke the 60 degree mark. It also broke our string of four consecutive months with colder than average monthly temperatures.
The total precipitation recorded for the month was 1.61 inches, 2.76 inches below normal. It was Norfolk’s fourth driest May in the last 84 years. Our top three driest Mays on record are 1993 with 1.06 inches, 1980 with 1.31 inches and 1964 with 1.33 inches. There were three thunderstorms observed this month, but nothing on the severe side. There was no snowfall. May’s average snowfall amount is just 0.4 inch.
For 2015, January through May, our total precipitation amount is just 14.21 inches. This is 6.55 inches below normal. We certainly need some rain to make up our growing rainfall deficit.
What will June’s weather bring us? As Norfolk Now goes to print late in the month, it appears that our rainfall deficit will not be getting any worse. In fact, through the first three weeks of June we were already nearly two inches above normal for monthly rainfall with more rain in the forecast. After an unusually cool start, the temperatures leveled off and became more normal. Temperature-wise it appears that it will be near average for a Norfolk June.

April 2015
From Deep Snow to Black Flies
By Russell Russ
Spring finally arrived in April. Amazing to think that in just this one month we went from maple syrup season, 16 inches of snow on the ground and all ponds fully iced over to springtime warmth with peepers and black flies.
Syrup season was over after the first week of April, and local lakes and ponds were ice-free by April 17. The final traces of snow were gone by April 16, peepers were out by April 17 and black flies were annoying us by month’s end. April is truly our big transition month.
April’s low temperature of 21 degrees was observed on April 2. The high of 72 degrees was observed on April 18. With an average temperature of 42.8 degrees, it was just 0.3 degree colder than average. So far, the first four months of 2015 have all been colder than normal. There were no daily temperature records set this month.
The total precipitation recorded for the month was 3.52 inches. This was 0.75 inch below normal. Through April, our total precipitation for the year was 12.60 inches, 3.79 inches below average. There were three thunderstorms observed this month. We are starting to build a rainfall deficit, so we need to pick up some rain over the next month or two.
There was just 1.0 inch of snowfall in April which made it 5.0 inches below average for the month. As the result, our 2014-2015 winter season snowfall total was a very average 91.9 inches (just 1.4 inches above normal for snowfall). We had snow for Thanksgiving which stayed around until Christmas. After just a week of no snow cover there was then constant snow on the ground from early January until April 16. Many locations were snowless in early April, but it hung around at the weather station until mid-month. For comparison, Norfolk’s 2013-2014 winter season snowfall total was 82.5 inches.
If you were hoping for some warm weather, you certainly got it in May. The first half of May was warmer than average, and continued our dry spell. As Norfolk Now goes to print, we are way below normal for rain. On the plus side, at least we won’t be dealing with snow for quite a few months.
March 2015
Another Cold Month, but Springtime Is Near
By Russell Russ
This winter and early spring continued to be cold, very much like last year. The big weather related news this March was the unprecedented water line and sewer line freeze-ups that occurred all over Norfolk and in surrounding towns. The depth of the frost was incredible and the cold temperature of the water coming out of Wangum Reservoir made for perfect freeze-up conditions. Running water to prevent water line freezing in many cases resulted in frozen sewer lines. Just a bad situation caused by extended cold temperatures and a harsh winter.
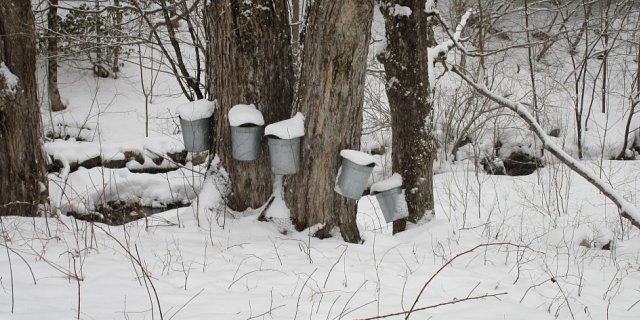
There were no big March snowstorms like we have seen in the past, but with no warm spells and just enough new snow to add to the January and February totals, we kept a deep snow cover throughout the month. Most ponds were not even thinking of losing any ice by the end of March. The maple syrup season was delayed in Norfolk and the entire maple syrup producing region of the Northeast. There was a slight change towards a little warmer springtime weather during the last week of the month. That warmer weather may not have been good for the late season skiers, but it helped save the maple syrup season for certain producers.
March’s low temperature of minus 1 degree was observed on both March 1 and 6 and the high of 50 degrees was observed on both March 10 and 11. With an average mean temperature of 25.6 degrees it was 5.2 degrees colder than normal, but it was 1.0 degree warmer than last March. For a few weeks it looked as if it might be a record cold March. It ended up being the ninth coldest March in the last 84 years.
The total precipitation recorded for the month was 2.35 inches, 2.13 inches below normal. It was a dry month, but nothing record setting. The monthly snowfall total of 13.7 inches was 4.4 inches below normal. The snow cover on the ground at the station ranged from 26 inches in early March to 17 inches at month’s end. A snow core taken in mid March indicated that there was six inches of water on the ground in the form of snow and ice.
The 2015 calendar year’s total precipitation amount of 9.08 inches was 3.04 inches below normal and the snowfall total of 70.2 inches was 10.8 inches above normal for this period. The snowfall total for this winter season, October through March, was 90.9 inches. This was 6.8 inches above normal and 0.4 inch above our normal entire winter season snowfall amount. We still have April and May to go until our winter snow season ends, but it looks like we probably will not see much more snowfall.
What will April bring? When will we finally make that transition into springtime? A quick look at the first half of April showed that it started seasonably cool, but there were signs of some very welcomed warmth. With a few days in the 60’s and the ponds finally losing their ice around the third week of the month you could say spring finally arrived. Another long Norfolk winter is behind us.

February 2015
Second Coldest Month on Record
By Russell Russ
This February will be remembered by millions of people for a long time. Many cities from Pennsylvania to Maine to upstate New York have reported that this February was their coldest month on record. These records only go back a hundred years or so, but still it was impressively cold. It was certainly a cold one in Norfolk as well, but it ended up being our second coldest month in over 83 years, and very nearly our third coldest. No, it was not the coldest, but here in Norfolk anything in the top ten for coldest means it was real cold. It was also a month with above average snowfall. Eastern Massachusetts, Rhode Island and eastern Connecticut hit the snowfall jackpot with record amounts of snowfall.
February’s low temperature of minus 12 degrees was observed on February 16 and the high of 35 degrees was observed on February 22. During a few of the colder days a few colder locations reported temperatures of minus 15 to minus 18. With an average mean temperature of 10.9 degrees it was 11.1 degrees colder than normal for Norfolk and our second coldest month on record. Hartford’s record setting monthly temperature was 16.1 degrees. According to our records, Norfolk’s top five coldest months since January 1932: Feb 1934 with 9.0, Feb 2015 with 10.9, Feb 1979 with 11.0, Dec 1989 with 11.5 and Jan 1982 with 11.7 degrees.
February is typically when we get most of our lowest daily temperature readings of the year. There were nine days this month with below zero temperatures and only two days with temperatures that were above freezing. We got close to daily low records on several occasions, but only the minus 10 on February 24 set a daily record, beating the minus 5 set on that date back in 1985.
The total precipitation recorded for the month was 2.55 inches, 1.06 inches below normal. All of the precipitation that fell this month was in the form of snow. The monthly snowfall total of 32.4 inches was 12.1 inches above normal. It was our 14th snowiest February on record. Last February’s total of 35.7 inches was ranked eighth. Our snowiest February was in 1969 when we measured 52.4 inches.
The 2015 calendar year, January and February, snowfall total of 56.5 inches was 15.2 inches above normal, but was five inches less than last year. The snowfall total for this winter season, October through February, was 77.2 inches. This was 11.2 inches above normal and just 1.8 inches less than last winter. We haven’t recorded as much snow as Boston this winter, but we still have March and April to catch up. Boston will more than likely top 108 inches of snowfall to break their winter season record. For comparison, Norfolk’s average winter snowfall is 90.5 inches and our snowiest winter was in 1955-56 when we recorded a total of 177.4 inches.
Just three years ago in 2012 we recorded our second warmest and our third least snowy February. What a difference a few years makes.
