
PREVIOUS WEATHER REPORTS
December 2014
Norfolk’s December Weather and a Yearly Summary for 2014
By Russell Russ
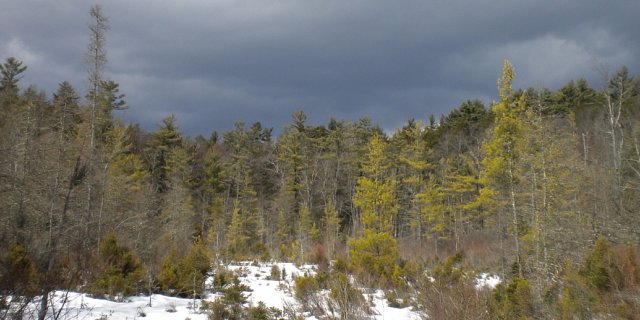
After late November’s big snow storm and cold temperatures, it seemed like winter was getting an early start here in Norfolk. Ted Childs, Norfolk’s original weatherman and founding father of the weather station, was known to say that a cold, snowy November often means that a cold, snowy winter will follow, but winter certainly didn’t hit us too hard in December. It was cloudy for a good part of the month with above average precipitation, but the temperatures were on the warm side and the snowfall was way below normal.
The monthly average temperature of 30.3 degrees was 4.8 degrees warmer than normal. This December was tied with 1994 as the tenth warmest December in the last 83 years. The month’s low temperature of 11 degrees was observed on December 8 and the high temperature of 57 degrees was observed on December 25, which made it the warmest Christmas Day since we began observations in 1932.
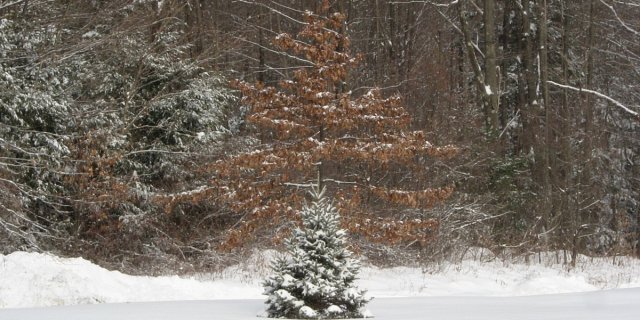
December’s total precipitation amount was 4.97 inches, 0.43 inch above normal. The monthly snowfall total of 4.4 inches was 12.9 inches below normal. With a foot of snow on the ground at Thanksgiving, it seemed that a white Christmas would be a given this year, but December started with just four inches on the ground and that was the deepest it got all month. By December 23 there was just a trace of snow in a few areas, and then it was gone. The snowfall total for this winter season, October through December, was 20.7 inches, four inches below normal.
Many smaller ponds in the area initially iced over in late November. The thin ice cover stayed until mid-December, but was mostly gone by Christmas. Smaller ponds finally iced over for the season on December 29 while Tobey Pond and Wangum Lake iced over on December 30.
In review of Norfolk’s weather for the 2014 calendar year, it was really fairly average. The yearly average mean temperature was 44.6 degrees, 0.2 degree cooler than normal. It was Norfolk’s coolest year since 2003, and before that you have to go back to 1997 to find a cooler year than the one we just had. For monthly temperatures, five months were below normal, six were above normal and one was normal. Globally, however, 2014 was the warmest year since global temperatures were first recorded in 1880.
The yearly total precipitation amount was 55.61 inches, 2.82 inches above normal. July was the wettest July on record and the ninth wettest month of any month on record. September was the driest September on record and the seventeenth driest month of any month on record. The yearly snowfall amount of 85.7 inches was 4.8 inches below normal, but it was a year with a few snowfall extremes. February was the eighth snowiest February in 83 continuous years of weather observations here at the Norfolk station, March came in with the second lowest snowfall amount of any March and then November came in as the ninth snowiest November on record.
November 2014
Transition to winter (with a very white Thanksgiving)
By Russell Russ
It has been said that November’s weather can predict the coming winter’s weather. This November was interesting in that it began warm and dry and then ended up cold and snowy. Overall, November ended up a little colder and a lot snowier than average with the second half of the month being quite cold and snowy. We transitioned from autumn to mid winter in the span of this one month. Fairly common actually, just as March can be the transition month into spring. With several days towards the end of the month in the teens, one day in single digits, and nearly a foot of snow on the ground for Thanksgiving it sure seemed like winter set in early and that we would be in for a good old fashioned winter.
Many smaller ponds, including Tamarack, McMullen and Pond Hill, began icing over around November 16. By November 22 they had iced over, only to go out and then back in by the end of the month. Tobey Pond and Wangum Lake stayed open throughout the month.
The month’s high temperature of 63 degrees was observed on November 4 and the low temperature of 9 degrees was observed on November 29. The average mean temperature was 35.5 degrees, 1.5 degrees below normal. Temperature-wise it was very similar to our last two Novembers, making it three in a row that were a little colder than normal. You have to go back to 1997 to find a colder November than our last three. In fact, Novembers 1995-1997 were also three in a row that were colder than normal, then we had fourteen in a row that were warmer than average. Could this be a pattern?
The total precipitation for the month was 3.53 inches, 1.11 inches below normal. Through November this year, the total precipitation amount was 50.64 inches. For the first eleven months of the year we were 2.39 inches above normal for this time period. With still one month to go until year’s end it is looking like a fairly normal year as far as precipitation goes.
The month’s snowfall total was an impressive 16.3 inches, 9.8 inches above normal. In 83 years of recording it was the ninth snowiest November on record. The snowiest November was 1968 with 24.7 inches. The snowstorm on November 26-27 measured 11.8 inches and according to our GMF weather records that was the third highest 24-hour snowfall total for a November since we began observations in 1932. This year’s 24-hour amount was only surpassed by November 25, 1938 with 16.8 inches and November 30, 1945 with 12.9 inches. Through November, the yearly snowfall amount for 2014 was 81.3 inches, 8.1 inches above normal and nearly 26 inches more than last year.
With one month to go until the end of the year it is looking like 2014 will go down as a fairly average year; a year with a few extremes here and there, but fairly average in the end.
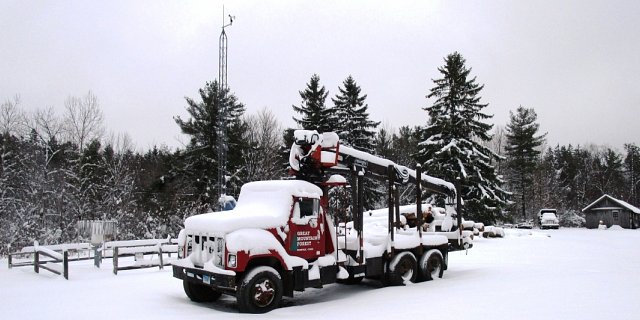
This month’s weather photo, taken November 27, shows GMF’s 1979 International F2554 log truck covered in November snow. Very soon GMF will be decommissioning the old International and “upgrading” to a 1966 Mack R600. The Prentice log loader will be moved from the International to the Mack. So begins a new era here at GMF.
October 2014
Warmer and wetter than normal
By Russell Russ
This October saw nearly four more inches of rain than last October. Temperature-wise it was very similar to our last two Octobers. There were six days this month with scattered frost in the area, but the first frost of the season at the weather station did not come until the morning of October 31. This is a little unusual; usually we see several frosts at the station during the months of September and October. With its higher elevation the weather station typically records fall frosts later than many of the lower lying valley areas in the region. Typically the weather station will record its first frost by early October. Not this year.
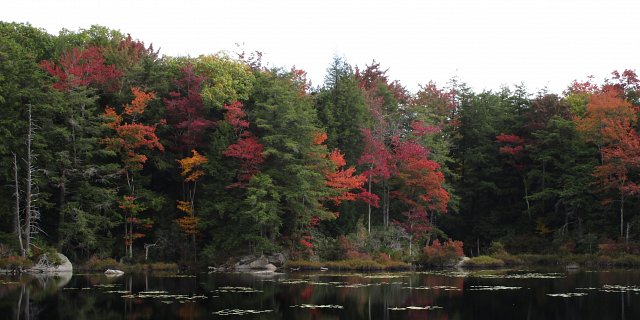
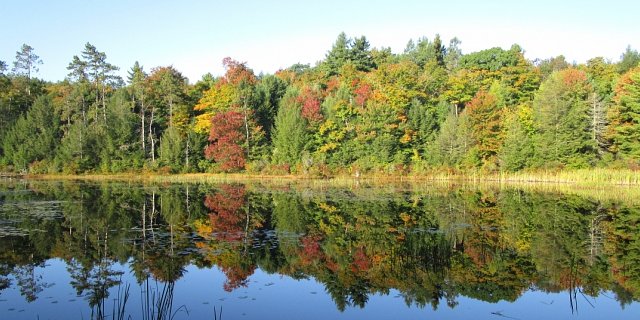
Always a point of debate, the foliage peaked in color about the second to third week of the month. This year it just seemed to take a little longer for most trees to show color and it lasted throughout the month. For those that love the colors, a long foliage season is not such a bad thing. Was it a good or bad foliage season? They are all good aren’t they?
The month’s high temperature of 72 degrees was observed on October 15 and the low temperature of 31 degrees was observed on October 31. Only one day got below freezing, the last day of the month. The average mean temperature was 50.3 degrees, 2.7 degrees above normal.
The total precipitation for the month was 5.30 inches, one inch above normal. There were two days with just a trace of sleet, but with no snowfall to record it was 0.9 inch below October’s normal snowfall amount. Through October, the total precipitation amount for the year was 47.11 inches. This is about a half inch more than last year through October. Through October this year we were 3.50 inches above normal for total precipitation and 1.7 inches below normal for snowfall.
There are many differing views on what this winter will bring. Will it be warm or cold, snowy or not snowy? It has been said that November is the month that will predict the coming winter’s weather. The first half of November was warmer and drier than normal. We shall see what the second half of November shows us.
September 2014
Driest September on Record
By Russell Russ
From June through September this year three of those four months were below average for rainfall. September was the driest September on record since 1932 when regular recording began at the weather station. Many locations in Connecticut were in drought conditions for a good part of the summer into early fall. How about Norfolk? Over this four month span Norfolk was actually 2.44 inches above normal for rainfall. Seems hard to believe, but thanks to July’s record rainfall of 12.76 inches we were above normal for precipitation. This July was the wettest July on record for us, surpassing the 11.47 inches recorded in July 1996. This July was also the ninth wettest month of any month on record. That is ninth out of 991 months of weather recording. In July in Norfolk, when it rained it poured.
September’s high temperature of 85 degrees was observed on both September 2 and 6. The low temperature of 40 degrees was observed on September 19. The average mean temperature was 60 degrees, 1.2 degrees warmer than average. There were no temperature records set this month. In fact, there were no temperature records set in June, July or August either. The summer months were all fairly average temperature-wise.
It is highly unlikely that we will see a temperature of 90 degrees or higher for the rest of the year. Norfolk typically hits 90 degrees or above about two to three times each year. Not this year. The highest temperature recorded at the station this year was 89 degrees on July 2. After that it was 86 on July 23 and then 85 on five other dates. No real heat waves and no days at or above 90 degrees. The icebox legend continues.
The rainfall total for September was just 1.16 inches. This was 3.56 inches below normal and made this September the driest on record. The old record for September was 1.31 inches in 1964. It was the seventeenth driest month of any month on record here at the weather station. While temperatures were fairly average all summer, we sure did see some wild swings in rainfall amounts. There were a combined total of seven thunderstorms in June, August and September. July alone had eleven.
Through September this year, the total yearly precipitation amount was 41.81 inches, 2.45 inches above normal. No snowfall or even frost at the weather station so far, but stay tuned over the coming months, many preliminary reports suggest it might be a cold and snowy winter. Then again, many reports also suggest if might be warmer than normal.

June 2014
Beautiful Summer Weather
By Russell Russ
Wait a month and hope for better weather. That is what we did and June came in with much better weather than May. Compared to a cloudy May, this June was full of beautiful summer weather. There was rain and there were a few thunderstorms, but more than half the month was sunny and pleasant. Rain is a good thing. It is even better when it comes at a good time, like at night.
June’s low temperature of 42 degrees was observed on June 1 and the high of 83 degrees was observed on June 3, 17 and 29. With an average monthly temperature of 64.4 degrees, it was 1.1 degrees above normal. There were no heat waves and no temperature records set this month. The temperature hit 80 degrees or above eight times, but 83 was as high as we got. No extremes this month.
The total precipitation recorded for the month was 3.23 inches, 1.56 inches below normal. There were three thunderstorms observed this month on June 3, 18 and 25. The storms on June 18 and 25 brought with them some heavy rain and a little wind. No extremes this month. This was very different from last year when 13.38 inches of rain was recorded in June, making June 2013 the wettest June in our 83 year history. It was also the fifth wettest month of any month on record. What a difference a year makes.
For the first half of 2014, January through June, our total precipitation amount was 24.16 inches. Through June we were 1.54 inches below normal. As of June we continued our trend of fairly average weather.
Now, an early look at July’s weather. Through July 20 the rainfall total was 10.22 inches. That is 5.93 inches above normal with eleven days still left in the month. Several days in July had already topped one inch, two inch and even three inch rain totals. As of July 20 it was already the second wettest July on record for Norfolk. The wettest July was in 1996 with 11.47 inches. It appears that our string of average weather will come to a close in July.

May 2014
Nothing Special
By Russell Russ
The month of May brought with it the final transition into summertime weather. May always holds the threat of one last parting shot of winter weather. That was not the case this year. There were no real cold temperatures and there was no snowfall. It was not a bad weather month, but it could not really be described as being all that nice either. There were numerous cloudy days, frequent days with rain and not many warm sunny days. Memorial Day turned out to be pretty nice weather-wise, always a good thing for the local parade and road race.
May’s low temperature of 34 degrees was observed on May 7 and the high of 84 degrees was observed on May 27. No temperature records were set this month, but we did come within three or four degrees of record temperatures on three days. With an average monthly temperature of 55.4 degrees, it was 0.7 degree above normal. May of last year had seven days with spotty frost, but this year there was no frost at the weather station and perhaps just a couple of days with spotty frost in some normally colder locations. The extended cool spring and seemingly cool and cloudy May resulted in a slight delay in the normal leaf-out and flowering period.
The total precipitation recorded for the month was 5.30 inches, 0.96 inch above normal. There were three thunderstorms observed this month, but nothing on the severe side. There was no snowfall. May’s average snowfall amount is just 0.4 inch.
For 2014, January through May, our total precipitation amount is 20.93 inches. This is just 0.02 inch above normal. For snowfall we are 1.5 inches below normal. You certainly could say that for the time being, 2014 has been fairly average as far as precipitation goes.

April 2014
Another Transition Completed
By Russell Russ
As is usually the case in April, winter finally released its firm hold and spring’s warmth slowly came into the picture. Very similar to last year, April began winter-like and then gradually warmed up. We started the month with nine inches of snow on the ground and all ponds still fully ice covered. Most local ponds and lakes lost their ice between April 10 and April 12. This was a few days later than last year, but still fairly typical.
The early April continuation of March-like weather helped salvage the 2014 maple syrup season at the Great Mountain Forest Sugarhouse and no doubt other local syrup producers as well. Continuously cold temperatures delayed the start of the syrup season by more than two weeks this year and the unfavorable conditions continued until the very end of March. Two to three weeks of halted production means a great deal when a typical season lasts just six weeks.
April’s low temperature of 21 degrees was observed on April 16. The high of 74 degrees was observed on April 14. With an average temperature of 44 degrees, it was just about one degree warmer than average. The only temperature record this month was on April 17 when the low temperature of 22 degrees tied the 1946 record low for that date.
The total precipitation recorded for the month was 3.27 inches. This was 1.06 inches below normal. Through April, our total precipitation for the year was 15.63 inches. This was 0.94 inch below normal for precipitation, but still five inches higher than last year.
April’s snowfall total was just 2.6 inches, 3.6 inches below normal. The monthly snowfall total came from just one brief storm during the early morning hours of April 16 and was completely gone within a couple of days. The nine inches of snow cover we began the month with was gone by around April 10. We are most likely done with snow for the season, but light snow or flurries can occur during May here in Norfolk.
For the 2014 calendar year the snowfall total is currently 65 inches, 1.1 inches below normal. January and February were above normal and March and April were below normal. Our 2013-2014 winter season snowfall total was 82.5 inches. This was 8.4 inches below normal, but not record setting in any way.
March 2014
Very Strange Weather Month
By Russell Russ
Winter continued to keep spring held back during our month of March. The continued cold winter temperatures were near record breaking levels, but what was really unusual was the lack of rain and snow for most of the month. After a snowy December through February period it was odd to have such a snow-free March. There was snow on the ground every day this month, but it was just because it never melted from the previous months. Had it not been for a brief warm-up and heavy rains during the last few days of the month, March would have ranked in the top three for cold, lack of rain and lack of snowfall. It was no surprise that most local ponds and lakes kept their ice throughout the month.
March’s low temperature of minus 2 degrees was observed on March 1 and the high of 52 degrees was observed on March 11. With an average mean temperature of 24.6 degrees it was six degrees colder than normal and turned out to be the fifth coldest March in the last 83 years. It was our third consecutive month with colder than normal temperatures. The coldest March on record was in 1960 when the average monthly temperature was just 21.2 degrees.
The total precipitation recorded for the month was 4.08 inches, 0.46 inches below normal. Over three inches of this monthly rainfall came during the last few days of the month. Up to the last few days it was on track to be the third driest March on record. The monthly snowfall total of just 0.9 inches was 17.3 inches below normal and totally unexpected. It was our second least snowiest March on record. Our least snowiest March was in 1946 when we measured just 0.5 inches of snow. Up to the last day of the month it was on track to be tied with 1946 as least snowiest, but a little sleet changed that. Sleet is considered snow, but you could certainly argue that point.
The 2014 calendar year, January through March, total precipitation amount of 12.36 inches was just about normal. The snowfall total of 62.4 inches for this period was 2.5 inches above normal. The snowfall total for this winter season, October through March, was 79.9 inches. This was 4.8 inches below normal. We lost a lot of ground in the snow department during March.
February 2014
EIGHTH SNOWIEST FEBRUARY ON RECORD
By Russell Russ
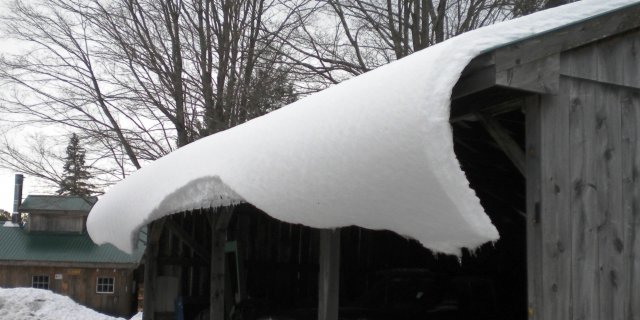
Old Man Winter made his presence known in December, established himself in January and decided to stick around through February. No temperature records were broken, but it was a cold month. And then there was the snow. Again not record shattering, just regular and steady snowfalls throughout most of the month. With our snow on ground levels ranging from six inches early in the month to 26 inches mid-month to 21 inches at month’s end, it just seemed snowy. With just a handful of days with warmer than freezing temperatures, the snow that came never left. That snow on everyone’s rooftops just stayed there and in some cases formed those dreaded ice dams. February last year brought us back to winter reality with its more normal cold and snowy conditions. This year there was no doubt, winter was back in town.
February’s low temperature of minus 2 degrees was observed on both February 7 and 12. The high of 47 degrees was observed on February 22. With an average mean temperature of 20.3 degrees it was 1.6 degrees colder than normal. The month of February is typically when we get most of our lowest temperature readings of the year and while we did get several mornings with below zero temperatures this month, no super low temperatures were recorded. For comparison, February 2013 was two degrees warmer than normal and February 2012, our second warmest February on record, was eight degrees above average.
The total precipitation recorded for the month was 4.16 inches, 0.52 inches above normal. The monthly snowfall total of 35.7 inches was 15.3 inches above normal. It was our eighth snowiest February on record. Our snowiest February was in 1969 when we measured 52.4 inches. Nearly half of this month’s snowfall came during the February 13-14 storm when 14.5 inches was measured at the station. For comparison, February 2013 was nearly six inches above average for snowfall and February 2012, tied with 1941 as third least snowiest February, was 14.5 inches below average. February 2012 was also our second driest February on record.
The 2014 calendar year, January and February, snowfall total of 61.5 inches was 19.8 inches above normal and also 27.7 inches more than this period last year. The snowfall total for this winter season, October through February, was 79 inches. This was 12.5 inches above normal and also 23.3 inches more than last winter.
January 2014
GOOD OLD FASHIONED WINTER
By Russell Russ
In 2014 the weather station began its eighty-third year of continuous weather observation and the year started off with Old Man Winter showing us what he’s made of. January is on average our coldest and snowiest month, and it was true to form this year. Three days this month recorded high temperatures at or above 51 degrees, but there were also nine days with low temperatures at or below 0. Last January there were only two days at or below 0. There were only four days with no snow cover on the ground. The maximum snow-on-ground depth was 10 inches.
With an average mean temperature of 17.5 degrees, January was 3.2 degrees below normal. It was the second coldest January in the last ten years, but only our nineteenth coldest January on record, tied with 1984. The coldest January on record was 1982, when the average mean temperature was 11.7 degrees. The month’s high temperature of 56 degrees was observed on January 11, a record high for that date, beating the old daily record of 54 set in 1975. The low temperature of minus 9 degrees, our coldest temperature of the season so far, was observed on January 22. It did not set a record though. A low temperature of minus 5 on January 3 did tie the 1981 and 2008 record low for that date.
January’s total precipitation of 4.12 inches was just a little above normal. The monthly snowfall total of 25.8 inches was 4.5 inches above normal and 18.2 inches more than last January. The snowfall total for this winter season, October through January, is 43.3 inches, 2.8 inches below normal, but 13.8 inches more than we had last year through January.
