
PREVIOUS WEATHER REPORTS

December 2012
Norfolk’s December Weather and a Yearly Summary for 2012
By Russell Russ
December came in tied with the December of 1996 as Norfolk’s eighth warmest December in the last eighty-one years. No daily temperature records were set this month, but with an average mean temperature of 31.2 degrees it was 5.8 degrees warmer than normal. The month’s high temperature of 54 degrees was observed on December 4 and the low temperature of 15 degrees was observed on December 26.
December’s total precipitation amount was 6.08 inches, 1.56 inches above normal. The monthly snowfall total of 15.2 inches was 2.1 inches below normal. For those keeping track, Norfolk did have a white Christmas, unlike last year. The snowfall total for this winter season, October through December, was 21.9 inches, 2.9 inches below normal.
Many smaller ponds in the area iced over initially in November, but then went out again in early December. Most iced over for good around Christmas Eve. Tobey Pond and Wangum Lake were still mostly open through the end of the month. By early January they should both be iced over. Last year Tobey and Wangum iced over by around December 27.
In review of Norfolk’s weather for the 2012 calendar year it was yet another year for the record books. With an annual average mean temperature of 48.5 degrees it was 3.7 degrees above normal and was the warmest year on record since observations began at this station in 1932. Other than June which was exactly average and November which came in 1.7 degrees below normal, every other month was above normal for temperatures. Many locations throughout the Northeast also recorded their warmest year, and some of those records go back to the 1820’s. With a total precipitation amount of 45.98 inches it was 6.89 inches below normal. Dry as it was, it was not even in the top twenty percent for driest years. The yearly snowfall amount of 50.5 inches placed 2012 as our fifth least snowiest year. This was nearly 41 inches below our normal yearly snowfall amount.

November 2012
Driest November on Record
By Russell Russ
November was a record setting month. It was the driest November on record for us, which means the driest over the last eighty-one Novembers. It was also the seventh driest month of any month for this same time period. Not what we needed this year, but certainly one for the record books.
The month’s low temperature of 17 degrees was observed on November 6 and the high temperature of 62 degrees was observed on November 11. The average mean temperature was 35.4 degrees, 1.7 degrees below normal. There were no daily temperature records set this month, but it was the coldest November since 1997. Looking back at our records, this month was the twentieth coldest November on record. Not really that noteworthy until you notice that it was the coldest one in the last 15 years. Does this mean something? Good question.
The total precipitation for the month was a mere 0.84 inches, 3.85 inches below normal and the driest November on record. The next few driest Novembers were 1976 with 1.04 inches, 1946 with 1.52 inches, 2001 with 1.54 inches and 1933 with 1.98 inches. As for driest months of any month here is that list: Feb. 1987 with 0.60 inches, Oct. 1963 with 0.63 inches, Mar. 1981 with 0.64 inches, Aug. 1953 with 0.65 inches, Jan. 1970 and Jun. 1988 with 0.74 inches, and Dec. 1943 with 0.83 inches.
Through November this year, the total precipitation amount was 39.90 inches. For the first eleven months of the year we were 8.45 inches below normal for this time period. With still one month to go, 2012 is currently the fifth driest year on record for this weather station. At this time last year, which ended up being the wettest year on record, we were nearly 24 inches above normal.
The month’s snowfall total was 6.7 inches, 0.1 inch above normal. Through November, the yearly snowfall amount for 2012 was 35.3 inches, 38.7 inches below normal for this time period. This is nearly 70 inches less than last year’s snowfall total through November. With still one month to go, 2012 is currently ranked second for least amount of yearly snowfall.
It has been said that November’s weather, especially the latter half of the month, is a good indicator of what the coming winter will be like. Does this mean that this winter will be cold with an average amount of snow? Good question again, but one thing is fairly certain, unless something really wild happens in December, 2012 will surely rank high on the record lists for lack of precipitation and lack of snowfall.
October 2012
Last year snow, this year Hurricane Sandy
By Russell Russ
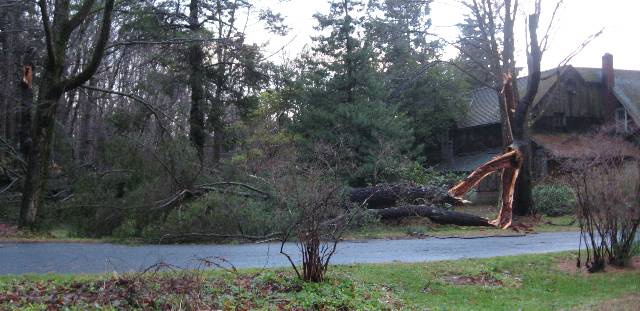
October is proving to be a wild weather month. Last year we saw nearly two feet of snow and this year we were hit with the affects of Hurricane Sandy. Sandy broke records and many have placed it in the Perfect Storm category of storms. A hurricane joining a nor’easter is not a good combination for the Northeast. In addition to causing widespread damage from North Carolina all the way to Maine it has the distinction of now holding the record for the lowest barometric pressure of any East Coast storm to make landfall north of Cape Hatteras. The Hurricane of 1938 still holds the record for lowest pressure at landfall. Sandy’s record low pressure was recorded just prior to landfall.
Connecticut was on the windy east side of the storm so was spared the heavy rains that states to our south and west had to endure. Norfolk was spared, but it certainly didn’t seem like it with all of the tree and power line damage that occurred. Most of Norfolk was without power for days while utility crews worked to repair the damage. Sandy will forever be remembered for the accurate way it was forecasted and for the widespread and extensive damage it caused.
The month’s high temperature of 72 degrees was observed on October 6 and the low temperature of 25 degrees was observed on October 13. The average mean temperature was 50.5 degrees, 2.9 degrees above normal. The first frost of the season came on October 13 and it was a killing one, effectively ending the growing season.
The total precipitation for the month was 6.15 inches, 1.84 inches above normal. Through October, the total precipitation amount for the year was 39.06 inches. Over the last three months we have decreased our rainfall deficit for the year, but through October we were still 4.6 inches below normal. The affects of Hurricane Sandy only brought us 1.72 inches of rain on October 29 and 30. Sandy’s winds were the big story around here. We actually had more rain on October 19 when we received 2.09 inches.
No snow fell this month. The average snowfall for October is 0.9 inches. What a difference a year makes. Last year nearly two feet, this year not even a flake was observed at the station. They say November is the month that will tell us what our winter will be like. We shall see over the next month. Stay tuned.

September 2012
Fall has arrived
By Russell Russ
The big weather news this month was – well, there really was not any big weather news this month, not here in Norfolk anyway. Last year we had record setting rainfall and much warmer than normal temperatures; this September was fairly normal. It was a bit unusual in the fact that we saw little to no effects from any hurricanes. Typically we see a frost or two in September, but there were no frosts at the station this month. The fall foliage season seemed to start just a little later than the past few years. Colors were in full swing by the latter half of the month and by the end of the month we were inching towards peak color.
The month’s high temperature of 81 degrees was observed on both September 1 and 7. The low temperature of 39 degrees was observed on September 24. The average mean temperature was 59.8 degrees, just one degree above normal. There were no daily or monthly temperature records set this month.
The total precipitation for the month was 6.34 inches, 1.62 inches above normal, but 6.91 inches less than last September’s total. There were two thunderstorms, both on September 8, and heavy rainfall on September 18, but other than that the rainfall was evenly distributed throughout the month.
Through September this year, the total yearly precipitation amount was 32.91 inches. This is 6.44 inches below normal through the month of September. We are gaining ground on our rainfall deficit. In comparison, through September last year we had received 62.37 inches, nearly twice as much as this year. Of course last year ended up being Norfolk’s wettest year in the last 80 years.

August 2012
Beautiful Summer Weather
By Russell Russ
Maybe it wasn’t the best August on record, but it was pretty nice as far as the weather goes. It was one of the nicer ones in recent memory anyway. Not too hot or cold, plenty of sunshine and just the right amount of rain. Sometimes we can get a cold snap during August, but not this year. If you like to complain about the weather there wasn’t much to say this month.
The month’s high temperature of 88 degrees was observed on August 4 and the low temperature of 46 degrees was observed on August 30. No daily temperature records this month and no days above 90 degrees. The 91 recorded on July 18 was the only time we broke 90 this summer. Our average for getting to 90 or above is 2 to 3 times per year. The average mean temperature for August was 68.7 degrees, 2.5 degrees above normal. The daytime temperatures were about normal, what keeps us warmer on average these days is that the nighttime temperatures don’t seem to be as low as they normally are. It was the warmest August since 2005 and ranked as the ninth warmest August over the last 81 years. Norfolk’s warmest August, based on our records, was in 2001 with an average temperature of 71.0 degrees.
The total precipitation for the month was 4.90 inches, 0.37 inch above normal. It was only the second time this year that we have been above normal in precipitation for a month. There were five thunderstorms observed at the weather station this month. Unlike recent years we saw no direct affects from any hurricanes.
Through August this year, the total precipitation amount for the year was 26.57 inches. This is 7.86 inches below normal for this period. We are below average in rainfall, but not overly dry and certainly much better off than many regions of the country. Norfolk has seen its fair share of bad weather, and will again for sure, so enjoy the good weather while you can.
July 2012
Hot Times in Norfolk
By Russell Russ
July typically is Norfolk’s warmest month of the year and this year it continued the 2012 pattern of being above normal in temperature. It has been drier than normal here in Norfolk, but we continue to be just wet enough to keep out of the serious drought conditions that are affecting a good portion of the country.
The National Weather Service noted that July 2012 was the hottest month ever recorded in the lower 48 states; not necessarily the hottest for every location, but on average for the contiguous United States. They began such records in 1895. Was it the hottest month ever for Norfolk? No, it was not. It actually was only Norfolk’s eighth warmest month since our records began here in 1932. Still, it does say something about our local climate if it was the eighth warmest month in our 967 months of weather observing.
The month’s low temperature of 52 degrees was observed on July 10 and the high temperature of 91 degrees was observed on July 18. This was the first time in 2012 that we hit 90 or above. Record high temperatures were recorded on July 17, when our 89 degrees tied the 1968 record, and also on July 18 when our temperature of 91 tied the 1935 record.
The average mean temperature in July was 70.7 degrees, 2.7 degrees above normal. It was the seventh warmest July and eighth warmest of any month since 1932. As warm as it was, it was still cooler than our last two months of July. July 2011 with 70.8 degrees, was the sixth warmest July (and seventh warmest of any month) and July 2010 with 71.5 degrees was the third warmest of any month. Norfolk’s warmest month, of any month, over the last 81 years was July 1955, with an average of 72.1 degrees.
The total precipitation for the month was 3.99 inches, just 0.32 inch below normal. There were three thunderstorms observed at the weather station this month with two of them produced brief pea-sized hail. We are starting to get our fair share of the bigger thunderstorms. This is typical for our mid to late summer period.
Through July this year, the total precipitation amount for the year was 21.67 inches. This is 8.23 inches below normal for this period. If we continue with this dry pattern for the rest of the year we could be looking at one of our top ten driest years.
…………………………………………….
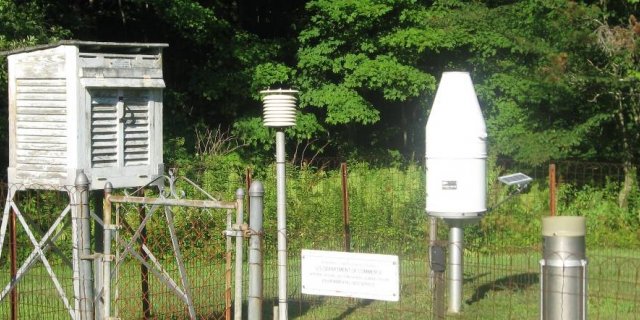
New Fischer-Porter Rain Gauge
On July 18, 2012 Norfolk 2 SW became just a little more modernized. A Fischer-Porter Recording Rain Gauge was installed by the National Weather Service. This rain gauge replaced our older Universal Recording Rain Gauge that had been in service for decades.
The advantage of the new gauge is that it contains a data logger that records the precipitation amount. At the end of each month, or when ever desired, precipitation data is downloaded to a SD card and transferred to a computer. The data is then sent on to the National Weather Service in Albany, NY for their records. A copy is also kept for Great Mountain Forest’s records. The new gauge does basically the same thing as the old gauge, but there are no paper charts or pens to be maintained or changed on a weekly basis. From the weather observer’s perspective this is very nice!
The new gauge gets power from a small solar panel and has a small battery back-up. The National Weather Service began installing the new gauges in Hawaii in May 2009, finally getting to Norfolk in July 2012. A long wait, but it should be well worth it.

June 2012
A Typical June for Norfolk
By Russell Russ
Temperature-wise June was exactly normal. It doesn’t happen too often, but the average temperature this month (63.3 degrees) was exactly average for the month of June. There were some hotter days and even a record high temperature, but it all averaged out to a fairly typical summer month.
June continued the pattern of all other 2012 months, except for May, of being drier than normal. We are inching towards drought conditions. Fortunately for us we are nowhere near the drought levels that many other parts of the country are recording. We have had a few thunderstorms, but fortunately (again) Norfolk has been spared from the more severe storms that other areas have seen this summer.
The total precipitation for the month was 3.19 inches, 1.56 inches below normal and 4.20 inches below the June 2011 total. There were three thunderstorms observed at the weather station this month, none of which produced hail.
The month’s low temperature of 44 degrees was observed on both June 6 and 7 and the high temperature of 89 degrees was observed on both June 20 and 21. The June 20 temperature was a record for that date, beating the old record of 87 set back in 1932 and 1995. Our 89 degrees on June 21 just missed the 1934 record by one degree. Our other hot day was June 29 when we reached 88 degrees, but that was a far cry from the all-time Norfolk record of 101 set back on June 29, 1933.
As hot as it has seemed, we have not topped 90 degrees here at the Norfolk weather station (as of the end of June). Typically, we hit 90 or above two to three times a year.
Through June this year, the total precipitation amount for the year was 17.68 inches. This is 7.91 inches below normal and 15.34 inches below where we were after June 2011. Through the first half of 2012 we are just about at the opposite end of the rainfall spectrum from where we were last year. What a difference a year makes.

May 2012
Summer is on its way
By Russell Russ
May continued Norfolk’s string of sixteen consecutive months with above normal temperatures. It was fairly cool for about the first half of the month with some locations getting light frost or close to it on several occasions. We dipped into the mid to upper 30’s a few times, but no frost was observed at the weather station. Our opportunity to finally record a cooler than normal month for a change was quickly eliminated when the temperatures increased towards the end of the month. It warmed up quite a bit actually, with two days setting high temperature records. It was a hot Memorial Day ending with thunderstorms during the evening hours. Perhaps it was our weather’s way of leading us all into the summer season.
May’s low temperature of 36 degrees was observed on May 12 and the high of 89 degrees was observed on May 29. With an average temperature of 59.2 degrees it was 4.6 degrees above normal. Two high temperature records were set this month. The high temperature of 86 degrees on Memorial Day, May 28 just beat the 85 set in 1934 and the 89 degrees on May 29 shattered the old 1955 record of 83.
The total precipitation recorded for the month was 4.78 inches, 0.44 inches above normal. It was the first time this year that we recorded an above average rainfall total. No snow or sleet fell during the month. On average that is less than half an inch below normal.
The snowfall total for the 2011-12 winter season, October through May, was 55.7 inches, which is 35.1 inches below normal for a season. This was way below normal. A quick review of our 80 year history solidly places the 2011-12 winter season in Norfolk’s top ten for least amount of winter season snowfall.
For the 2012 calendar year our snowfall total of 28.6 inches is 37.4 inches below normal. Our total precipitation amount of 14.49 inches is 6.79 inches below normal. We are not in water trouble yet, but we do need to pick up some rain over the next few months so we stay out of drought conditions.

April 2012
Finally, not a record setting month
By Russell Russ
After record warmth this winter and after March’s unprecedented warmth it seemed that we would be well on our way into summer by the time April rolled around. This was not the case. April was more average than everyone expected. March certainly pushed many plants way ahead of schedule, but April’s more normal weather brought everything a bit more back to normal. Precipitation and snowfall were below normal and we did have a mini heat wave during the middle of the month, but all in all it was fairly normal for April. Many trees and plants did leaf-out weeks earlier than normal, but March played a much larger role in this than April.
April’s low temperature of 25 degrees was observed on April 3 and 6 and the high of 86 degrees was observed on April 16. With an average temperature of 45.4 degrees it was 2.5 degrees above normal. The high temperature of 86 degrees on April 16 did set a new record for that date, just beating the old record of 85 from 2002.
The total precipitation recorded for the month was 2.78 inches, 1.52 inches below normal. Had it not been for a rainfall of over two inches on April 22 and 23 it would have been record worthy for being dry. April’s snowfall total was just a trace with flurries and sleet falling on just two days. April typically gets about six inches of snow. Thanks to a late March snowfall we began the month with an inch of snow on the ground, but after April 1 the snow was gone for the season.
The snowfall total for this winter season, October through April, is 55.7 inches, which is 34.7 inches below normal for this time period. It is still hard to believe that 23.8 inches of this snow fell in October. For the 2012 calendar year our snowfall total of 28.6 inches is 37 inches below normal and our total precipitation amount of 9.71 inches is 6.79 inches below normal. This lack of rain and the lack of a snowpack from this winter may prove troublesome as we head into the summer months.

March 2012
Warmest March on Record
By Russell Russ
It really was the winter that wasn’t. March was our fourteenth consecutive month with warmer than normal average temperatures. You have to go back to January 2011 to find a month with below-normal temperatures. March even took it to a new level by being the warmest March in our 81-year recording history. Precipitation was way down and temperatures were way up. This combination resulted in a higher-than-normal forest-fire risk, creating the need to issue Red Flag Warnings.
March’s low temperature of 13 degrees was observed on March 6 and the high of 76 degrees was observed on March 19. With an average temperature of 41.8 degrees it was an amazing 11.3 degrees above normal. March 2012 is now the warmest March we’ve recorded since we began in 1932, beating the old March 1946 record of 40.9 degrees. The average monthly temperature for March is 30.5 degrees so this March was really more like a normal April than a March. This unusual warmth has been the theme all winter long.
Four days in March set new high-temperature records for that date, and three days fell just short. On March 12, the temperature climbed to 66 degrees, shattering the previous record of 60 degrees set in 1977. A heat wave on three successive days in the third week, on March 18, 19, and 20, saw temperatures reach records of 71, 76, and 75 degrees respectively, displacing earlier records of 65, 65, and 73 degrees set in 1966, 2010, and 1945.
The total precipitation recorded for the month was 2.07 inches, 2.44 inches below normal. It was the sixth driest March in the last 81 years. March’s snowfall total was 11.4 inches, 6.7 inches below normal. Not record-worthy, just below normal as has been the case all winter long.
The snowfall total for this winter season, October through March, is 55.7 inches, which is 28.5 inches below normal for this time period. For the first quarter of 2012, our snowfall total of 28.6 inches is 30.8 inches below normal and our total precipitation amount of 6.93 inches is 5.27 inches below normal. As far as precipitation goes this is pretty much the opposite of where we were last year at this time.
The scant snow cover vanished on March 12, the first day of record-setting heat, and the ground remained bare until a 3.4-inch snowfall on March 31. Norfolk’s ponds, which froze slowly this year—the shallow ones in late December and the deeper ones in mid-January—lost and then regained their ice cover in February, then showed open water again for the season between March 8 and 12. This was four weeks earlier than last year and two weeks earlier than in 2010. Coinciding with the warm spell that doomed the pond ice was the early end to the local maple syrup season. This spring’s syrup season was nearly three to four weeks shorter than normal, or about half the length of a typical season, which lasts six to seven weeks.
