
PREVIOUS WEATHER REPORTS
December 2019-Part 2
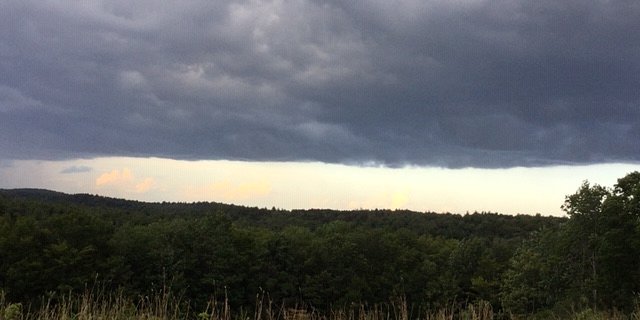
Ice storm in Norfolk December 29-31, 2019
By Russell Russ
During the final days of 2019, Norfolk experienced one of the most notable weather events of the entire year. With temperatures above freezing, rain began falling during the afternoon of December 29. The rain continued into the evening, but by early evening temperatures were hovering around 32 degrees. Freezing rain continued overnight into the next morning. At 8:00 am on December 30 a total of 0.96 inch of rainfall was recorded with an ice accretion of 0.15 inch. Temperatures continued to stay at or below freezing during the day on December 30 and the freezing rain with some sleet mixing in also continued throughout the day. At 3:00 pm, with sleet falling, a strong thunderstorm producing nickel to quarter sized hail was observed. Numerous lightning strikes, loud crashes of thunder and several minutes of large hail resembling large mothballs were observed. Another weaker thunderstorm brushed Norfolk at 4:45 pm, also while sleet was falling. Soon after the second round came through, the precipitation turned to light snow. By 8:00 pm when the snow stopped there was a little over an inch of snowfall. More freezing rain fell during the early hours of December 31, adding more ice on top of the heavy weight that was already hanging on trees and powerlines. At 8:00 am on December 31 a total of 0.63 inch of precipitation was measured, including 1.2 inches of snow and sleet. At this time there was an ice accretion of 0.3 inch. There were several power outages reported in town.
A storm total of 1.59 inches of precipitation, including 1.2 inches of snow and sleet was measured. The ice buildup on the trees was the big problem, but only in locations above about 1,200 feet in elevation. At lower elevations the temperatures stayed mostly above freezing during the entire storm. Making the situation worse for the trees was the fact that temperatures for the next few days never got much above freezing. Had there been high winds during the storm then the tree damage and power outages would have been much worse. At many locations the ice did not begin to come off the trees and powerlines until the afternoon of January 3. Based on observations and local input, most of the ice damage seemed to be centered in the higher elevations of Canaan, Norfolk, Winchester, Colebrook and Hartland.
Norfolk in the past has experienced more severe ice storms that have produced much more damage. What made this late December 2019 storm unusual was the very specific (higher) elevations it affected and of course the thunder and lightning and large hail which occurred while sleet was falling. One unfortunate casualty from the storm was one very old, very large sugar maple on the Norfolk Village Green. The old maple had been declining in recent years and the heavy ice buildup from this storm was just more than it could stand. A large portion of the tree fell onto the green, barely missing the soldier’s monument and the Town’s new Christmas tree. The old maple had to be completely removed.

December 2019-Part 1
Norfolk’s November & December Weather & a Yearly Summary for 2019
By Russell Russ
The year of 2019 came to a close with winter conditions making the headlines. November was considerably colder than normal and December had an above normal snowfall total. Unlike some recent years when winter seemed to be delayed until January, the close of 2019 took place with winter conditions firmly in place. To cap off the year, December closed out with an ice storm that featured thunderstorms and large hail. The conclusion of 2019 completes 88 years of continuous daily weather observations at the Norfolk 2SW weather station.
November’s average temperature of 33.3 degrees was 3.8 degrees below normal. It was Norfolk’s coldest November since 1996 and was tied with 1932 for being Norfolk’s 11th coldest November over the last 88 years. Temperatures ranged from a high of 67 to a low of 10 degrees. The low of 10 degrees on November 13 was a new daily record low temperature for that date, surpassing the old record of 17 from 1933. Precipitation for the month totaled 4.31 inches, 0.29 inch below normal. The monthly snowfall total of 5.2 inches was 1.5 inches below normal. The first measureable snowfall of the season came on November 7 when 0.9 inch was recorded. There was one day in November with rare thunder snow. With November being nearly four degrees colder than normal it might possibly indicate that we are in for a cold winter.
December’s average temperature of 26.9 was 1.2 degrees above normal. Temperatures in December ranged from a high of 50 to a low of 3 degrees. There were no daily temperature records set this month. With a total precipitation amount of 6.82 inches, it was 2.30 inches above normal. It was Norfolk’s 9th wettest December over the last 88 years. December’s monthly snowfall total of 20.8 inches was 4.0 inches above normal. Norfolk experienced two days in December with thunder snow. An ice storm December 29-31, with two waves of thunder and lightning, one of which produced nickel to quarter-sized hail, was clearly the most notable weather event of the month.
With colder than normal November temperatures, many smaller local ponds were ice covered by November 13, but then all were ice free by later in the month, only to be iced over once again by December 1. Tobey Pond and Wangum Lake iced over initially on December 7, but then went out and back in several times through the end of the year. By December 31 most local lakes and ponds were ice covered. It was a close call once again for having a white Christmas, but most of Norfolk did in fact have one (just barely). Most other parts of the state did not have one this year.
Norfolk’s weather for 2019 was fairly unremarkable. January to May were all below normal for snowfall. March, May and November were on the cold side while April and July were on the warm side. There was a nice stretch of continually pleasant weather from mid-June through September. Nine out of twelve months were above normal for temperature, seven out of twelve were below normal for precipitation and seven out of eight winter season months were below normal for snowfall. Notable months were March for being the 3rd driest March and July for being the 3rd warmest July and also the 3rd warmest month of any month. During the entire year there were two days with record daily low temperatures and six days with daily record high temperatures.
The coldest days of the year were January 21 and 31 with low temperatures of minus 12 degrees. There were seven days in 2019 with temperatures of zero or below zero. The warmest days of the year were July 20 and 21 when both reached 90 degrees. In total, there were two days in 2019 that recorded temperatures of 90 degrees or above. The yearly mean temperature was 45.6 degrees, just 0.6 degree above normal, ranking it tied with 1932 as Norfolk’s 16th warmest year over the last 88 years.
The yearly total precipitation amount of 53.23 inches was just 0.62 inch above normal. Overall, it was a very average year for total precipitation. The yearly snowfall amount of 65.3 inches was 24.5 inches below normal, ranking it as Norfolk’s 15th least snowy year over the last 88 years. Had it not been for December’s above average snowfall, the yearly total would have been considerably less and higher ranking for least snowfall.

October 2019
Ninth Wettest October on Record
By Russell Russ
The weather in the Norfolk area had been quite nice since June. The summer months were on the warm and dry side. Pleasant had been a way to describe the weather for this span of four months, including through September. That all ended when the calendar turned to October. A thunderstorm during the morning of October 1 signaled (with a bang) that a change in the weather was on the horizon. The fall foliage season, which began in September as one of the best in recent memory, peaked as usual around Columbus Day. The nice fall foliage extended into October, but the month’s wet and often stormy weather did put a damper on it.
Of October’s thirty one days, seventeen were mostly cloudy, thirteen were partly cloudy and only one was classified as mostly clear. Rainfall was observed on twenty days during the month. There were at least seven days with frost reported in the area. Some people say winter can begin when the swamps are full. The swamps were definitely full by the end of the month.
The month’s high temperature of 76 degrees was observed on October 2. The low temperature of 30 degrees was observed on October 5. It was close on a few days during the early part of the month, but there were no daily high or low temperature records set this month. The monthly mean temperature of 49.3 degrees was 1.5 degrees above normal. Norfolk’s warmest October was in 2001 with 55.3 degrees. The coldest was in 1974 with an average temperature of 42.0 degrees. The first frost observed at the weather station this year was on October 5, last year it was on October 18.
The total precipitation for the month was 7.12 inches, 2.80 inches above normal. This October was Norfolk’s ninth wettest October over the last 88 years. So ends Norfolk’s long stretch of pleasant and mostly dry weather. Norfolk’s wettest October occurred in 1955 with 17.28 inches (also second wettest of ANY month). The driest October was in 1963 with just 0.63 inch (also the second driest of ANY month). Wintery precipitation (snow/sleet) can occur in October here in Norfolk. Often the first flakes of the season fall in October. The average snowfall amount for the month is 0.9 inch, but there was no wintery precipitation observed this October.
Through October, the total precipitation amount for the year was 42.10 inches. This was 1.39 inches below normal for the year, but October’s surplus took a considerable bite out of the running yearly deficit. There are still two months to go in 2019, but it is looking like it could be a fairly average year for precipitation.
It has been stated that November can sometimes predict what type of winter we will have. To be more precise with this “out on a limb” prediction, if November’s average monthly temperature is four degrees above or below the monthly average, then it often foretells the winter temperatures to come.
The first snow of the season came on November 7. Through November 20, both total precipitation and snowfall were running about normal for the month. What was not normal were the temperatures. Norfolk’s temperatures were running about 4.5 degrees below normal. It was also a cold first part of November for much of the U.S. This just might mean that a cold, and perhaps snowy, winter lays ahead. Stay tuned.

September 2019
The Arrival of Autumn
By Russell Russ
The first half of September was about normal for temperatures, September temperatures that is. It was a mostly cloudy first half of the month with normal amounts of rainfall. It was a noticeable change from the near non-stop warm and beautiful weather Norfolk had experienced since June. The second half of the month had many clear and quite warm days. On top of the pleasant weather, the fall foliage just seemed to be better than it has been in recent years. Autumn coloring became very noticeable by mid-month and progressed very nicely all throughout the month. Hard to complain about the early fall weather around here, except perhaps for the lower than normal amount of rainfall and slowly increasing rainfall deficit.
September’s low temperature of 36 degrees was observed on September 19 and the high of 83 degrees was observed on September 23. The average mean temperature was 59.5 degrees, just 0.5 degree above normal. Two days late in the month reached record levels for warmth. The 83 degree high on September 23 surpassed the old record of 82 set back in 1970 and the 75 observed on September 28 tied the 1948 record for that date.
Frost occurred in many lower elevation valleys in the Northwest Corner on September 19 and 20. There was no frost at the relatively higher elevation weather station during the month. Norfolk’s warmest September was in 2015 with a mean temperature of 64.7 degrees. The coolest was in 1963 with a mean temperature of 53.6 degrees. Temperatures this September were very much normal.
The month’s rainfall total was 2.87 inches, 1.82 inches below normal. It was also 5.90 inches less than last September’s total. What a difference a year makes. September was Norfolk’s fourth month in a row with below normal rainfall totals. The lack of rainfall this year is becoming a bit of a concern, but only locally. There is no widespread regional drought this year. Norfolk has just ended up on the lower end of rainfall totals since June. On the flip side, Norfolk has seen some very nice (and dry) weather since June. Norfolk’s wettest September was in 1938 with 13.40 inches (thanks to the Hurricane of ’38). The driest was in 2014 with just 1.16 inches.
Through September this year, the total yearly precipitation amount was 34.98 inches. This was 4.19 inches below normal. It was also 14.10 inches less than the yearly total through last September. What a difference a year makes. There was no wintery precipitation observed this September, but it has occurred during six days in the month of September over the last 88 years. Septembers in the years of 1946, 1947, 1950, 1974 and 1992 all saw trace amounts of wintery precipitation (snow and/or sleet). It is getting about that time when we once again talk about wintery precipitation.
What will October’s weather be like? By two-thirds of the way through the month it seems that we have begun to gain on our rainfall deficit. Through October 23 the monthly precipitation total of 5.91 inches was already 1.59 inches above normal. The season’s first widespread frost came on October 5. Foliage once again peaked around mid-month in the Norfolk area. This autumn was above average for beautiful fall foliage coloring. No wintery precipitation has been recorded yet, but as we inch closer to winter, it is just a matter of time before we see its return.
August 2019
Beautiful Summer Weather
By Russell Russ
If you like nice summer weather, then August was your month. Weather-wise, it was very much an average August for Norfolk. Although other parts of the state recorded numerous days with heavy rain, strong thunderstorms and even a possible tornado or two, Norfolk experienced little or no severe weather.
August’s high temperature of 86 degrees was observed on August 19. That 86 degrees tied the 1987 record high temperature for that date. The low of 47 degrees was observed on August 26. The monthly mean temperature of 67.4 degrees was 1.0 degree above normal. Norfolk’s warmest August on record was in 2001 with a temperature of 71.0 degrees. August 2018 with 70.9 is the second warmest. The coolest August on record was in 1964 with 61.5 degrees.
The total precipitation recorded for the month was 4.45 inches, just 0.17 inch below normal. Norfolk’s wettest August and wettest month of any month was in 1955 with 23.67 inches. Coming in second wettest for August is 2011 with 13.36 inches. Norfolk’s driest August was in 1953 with just 0.65 inch, ranking it as Norfolk’s fourth driest month of any month. The month of August can have big swings for precipitation amounts here in Norfolk. Hurricanes obviously play a large role in this.
Through August, the total precipitation amount for the year was 32.11 inches. This is 2.37 inches below normal. Norfolk is carrying a small deficit for 2019, but it is not all that bad. Many other areas in the region have seen much more precipitation. There is no widespread deficit in the Northeast this year.
A look ahead into September’s weather through mid-month shows that the beautiful weather, for the most part, continued to bless Norfolk. Temperatures and rainfall were running about average for September. It has been a relatively quiet hurricane season and so far there have been no hurricanes that have affected northwestern Connecticut. As is usually the case, Norfolk’s fall foliage season started in late August to early September. It should be a beautiful fall foliage season in Norfolk this year. The peak day for foliage will be —— anyone’s guess. Get out and enjoy the beautiful weather while it lasts.
July 2019
Third Warmest Month on Record
By Russell Russ
The month of July is typically Norfolk’s warmest month of the year and this July certainly lived up to that. There have been only two months over the last eighty-eight years that have been warmer than this July. While it was a very warm month with an abundance of humidity, it came in quite low for rainfall. Summertime warm and humid air often produces thunderstorms and heavy rainfall. We got that last July, but this July the big rains, while hitting many other parts of the state and region, did not hit Norfolk.
July’s high temperature of 90 degrees was observed on July 20 and 21. Both days missed record daily highs by just one degree. These were the first and only days so far this year when Norfolk hit 90 degrees or above. It was a very warm month with numerous days coming close to daily record highs, but there was just one day that actually hit a record. The high of 89 degrees on July 17 tied the 1968 and 2012 high for that date. The low temperature of 54 degrees was observed on July 25. July’s monthly mean temperature of 71.9 degrees was 3.7 degrees above normal.
This July was Norfolk’s third warmest July and third warmest month of any month over the last eighty-eight years. Norfolk’s top three warmest months on record are July 2013 with 72.7 degrees, July 1955 with 72.1 and July 2019 with 71.9. July 2018 with 71.5 degrees is tied with 2010 as Norfolk’s fifth warmest month. Norfolk’s six warmest months on record have all been in July. Norfolk’s coolest July occurred in 1962 with a monthly mean temperature of 63.9 degrees. The second coolest July was in 2000 with 64.4 degrees.
The total precipitation recorded for the month was 2.81 inches, 1.55 inches below normal. This July ranked as Norfolk’s twentieth driest July on record. Comparing this July to last July, this year saw 3.55 inches less rainfall than what was recorded for July 2018. The bigger storms may have hit Norfolk last year, but they missed town this year. There were four thunderstorms observed at the weather station, but none were severe in nature. The storm during the afternoon of July 22 produced 1.71 inches of rainfall, the largest of the month. Norfolk’s wettest July was in 2014 with 12.76 inches, the driest was 1939 with 1.29 inches.
Through May we were doing quite well for yearly precipitation. June and July were both below normal. Through July the total precipitation amount for the year was 27.66 inches. This was 2.20 inches below normal. We are now in a deficit and it is becoming noticeable in local lake and pond levels – and lawns. While we are a little below normal, it is no reason for great concern since this amount could easily be reversed with one or two rain events. If the deficit continues for several more months then it will be a bigger concern. We are far from record dry conditions.
An early look into August, through mid-month, showed that August’s weather was quite pleasant overall. Typical August summertime weather for Norfolk. There were some humid days, but it is August so that is normal. The warmest temperature through August 17 was just 82 degrees. Rainfall was about normal. Autumn is just around the corner. As is usually the case by mid-August, there is a faint sign of fall coloring showing up in some trees and several mornings have dipped into the low 50 degree range. Enjoy the summer heat while it is here. It will not be long before autumn arrives.

June 2019
Norfolk’s 10th Driest June on Record
By Russell Russ
June ended Norfolk’s string of seemingly constant wet weather that dates back to April. Overall, June was a fairly pleasant summer month with near normal temperatures. It was, however, quite dry. After a very wet April and wet May it was not all that bad to dry things out just a little. The month’s rainfall total was low, but it did rain. The weather turned warmer and more humid during the final days of the month.
June’s low temperature of 38 degrees was observed on June 4 and the high of 84 degrees was observed on June 28. With an average monthly mean temperature of 63.8 degrees, it was just 0.4 degree above normal. There were no new daily temperature records set this month. Norfolk’s coolest June was in 1958 with an average monthly mean temperature of 58.8 degrees. The warmest June was in 1943 with 68.3 degrees.
The total precipitation recorded for the month was just 2.08 inches, 2.79 inches below normal. It was Norfolk’s 10th driest June over the last 88 years. The driest June was in 1988 when only 0.74 inch was recorded. Our wettest June was in 2013 with 13.38 inches.
On June 22 there were two rounds of afternoon thunderstorms that just brushed Norfolk. Nearby towns reported small hail that day, but there was no severe weather in Norfolk. During the summer months, short duration downpours typically make up a large part of the monthly rainfall total, and also, the lack of them can mean a dry month. June was a dry month.
For the first half of 2019, Norfolk’s total precipitation amount was 24.85 inches. Through June, this puts Norfolk 0.65 inch below normal for the year. Nothing to worry about as long as the dry conditions do not continue through the second half of the year. The years of 2015 (8th driest) and 2016 (3rd driest) were back to back very dry years. Currently we are a long ways away from the low precipitation totals recorded in those drought years.
There was no wintry precipitation (snow or sleet) during June in Norfolk this year. It is extremely rare, but it has happened. There were trace amounts of snow and sleet observed on four days in June over the last 88 years. Snow flurries fell on June 20, 1940, June 13, 1965, June 18, 1965 and sleet was observed on June 30, 1988. Not only were these rare events observed and recorded, special notations were made by the weather observers after they witnessed these unusual events. Since 1932, July and August are Norfolk’s only two months that have not recorded any wintry precipitation.
An early look at July through July 21 shows that it certainly did warm up and the dry conditions did persist. July is historically our warmest month of the year and this July so far has been true to form. There were several near record setting hot days, but only July 17 with a high of 89 tied a daily record. The extreme heat wave of July 19-21 brought very hot and humid conditions to the Northeast. Norfolk was not spared. Although no daily high temperature records were set, Norfolk did hit 90 degrees at the weather station for the first time this year on both July 20 and 21.
Looking on the bright side, it still was considerably cooler in Norfolk than most other parts of the state. With 90 degree temperatures, a heat index of over 100 degrees and dew point temperatures in the 78-80 degree range it was about as hot as Norfolk gets. Thankfully, the extreme heat typically does not last long in Norfolk. Enjoy it, or not, while it lasts.

May 2019
Not Norfolk’s Best Weather
By Russell Russ
When will we see some sunshine? That was the theme for May’s weather. It was the theme for April’s weather as well. Difficult to say why our weather has been so dreary this spring, but it sure will be nice when the sunshine returns – and for more than a day or two in a row would be even nicer. A much welcomed taste of summer came during the Memorial Day weekend. The weather in Norfolk was beautiful for this year’s Memorial Day.
It is hard to believe, but wintery precipitation is fairly common in Norfolk in May. Not welcomed, but fairly common all the same. Over the last 88 months of May, Norfolk has recorded some form of snow or sleet for 41 of those months. There have been 29 Mays with just a trace of wintery precipitation and 12 Mays that have recorded more. Spring has arrived, but as usual it comes with a hint of winter.
May’s low temperature of 34 degrees was observed on May 13 and the high of 82 degrees was observed on May 26. With an average monthly mean temperature of 53.7 degrees, it was 1.2 degrees below normal. It was over 6 degrees cooler than last May. Last May was Norfolk’s 2nd warmest on record. Norfolk’s warmest May occurred in 2015 with a temperature of 61.8 degrees, the coldest was in 1967 with 46.8.
The total precipitation recorded for the month was 5.01 inches, 0.66 inches above normal. Through May, the total precipitation for the year was 22.77 inches. It seemed to rain (or snow) nearly every day this May, actually 22 of 31 days saw some form of precipitation, but the final totals were not excessive. At May’s conclusion Norfolk was looking at a precipitation surplus of 2.14 inches for the year. Norfolk’s wettest May was in 1984 with 12.34 inches, the driest was in 1980 with 1.31 inches.
May recorded just a trace of snow and sleet this year. As usual during the first and last snowfalls of the season, the Hartford TV stations were in town to do a segment on it. Norfolk’s 2019 snowfall total through May was just 39.3 inches, 26.1 inches below normal. Through last May the snowfall total was 91.1 inches. Quite the difference. Norfolk’s (and Connecticut’s) snowiest May on record was in 1977 when an amazing 20.0 inches was recorded. Our 2nd snowiest May was in 1945 with 5.6 inches.
The Winter Season officially ended after May and this season’s (October-May) snowfall total was 56.6 inches, 33.2 inches below normal. This Winter Season ranked as Norfolk’s 11th least snowy winter since 1932. Snow lovers will have to hope for better luck next year.
An early look at June’s weather through two-thirds of the month shows that temperatures and precipitation were running just a little below normal. The month’s first two weeks were nice, but it was back to the cool, cloudy and wet weather for the third week. Norfolk is still waiting for REAL summer weather to come and stay.
There was much weather talk this spring on how many continuous days there had been with some form of precipitation. This type of data is not directly tracked at this weather station so it is difficult to compare to previous years, but for 2019 through June 21 there have been 172 days and there has been some form of precipitation that fell on 113 of those days. Very generally speaking, that means that two-thirds of 2019 has been wet. People’s gut feelings are correct, this year’s weather has been not all that nice. Fair weather lovers will have to hope the rest of the summer comes in on the sunny side.

April 2019
7th Wettest April on Record
By Russell Russ
April is the transition month between winter and spring. It can have traits of both winter and spring and that is what Norfolk saw this April. It was warm enough early in the month to end the maple syrup season in the Norfolk area, but the remainder of the month only showed brief glimpses of warm spring weather. What seemed to be the theme of the month was the abundance of rainy days. Twenty-three of the month’s thirty-one days had at least a little of some form of precipitation. Dreary weather would describe it quite well.
April’s low temperature of 19 degrees was observed on April 2 and the high of 74 degrees was observed on April 19. With an average monthly mean temperature of 45.4 degrees, it was 2.3 degrees above normal. It was over 6 degrees warmer than last April. There were no record daily highs or lows this month and overall the entire month did not rank highly for warmth. Norfolk’s warmest April was in 2010 with an average mean temperature of 49.4 degrees and the coldest was in 1943 with 36.8 degrees.
The total precipitation recorded for the month was 6.97 inches, 2.75 inches above normal. It felt like it should have ranked higher, but it was only Norfolk’s 7th wettest April over the last 88 years. Through April, the total precipitation for the year was 17.76 inches, 1.48 inches above normal. After March we were running a precipitation deficit of 1.27 inches, but April’s rains turned that around.
April’s snowfall total was just 0.9 inch, exactly 5 inches below normal. Interestingly, last April was exactly 5 inches above normal. With only three days of the month with a trace to one inch of snow on the ground it was a very snow-free month. Through April, the 2019 calendar year snowfall amount of 39.3 inches was 25.7 inches below normal. The snow total after last April was 91.1 inches. What a difference a year makes.
The 2018-19 winter season (October-April) snowfall total of 56.6 inches is 32.8 inches below normal. The winter snow season ends after May, but it is unlikely we will see any more measurable snow so the 2018-19 season will likely rank as Norfolk’s 11th least snowy winter season.
A look ahead at May’s weather through May 24 shows that temperatures were running nearly 3 degrees cooler than normal. It was a cool and wet early May with many rainy days. With a week still left in the month the rainfall total of 4.15 inches was just shy of the average monthly amount for May. There were even periods of snow and sleet that fell on May 12 and 13.
Weather-wise, many days felt more like March or April than May. Winter weather is unwelcome in May, but it is fairly common for Norfolk to see at least a little wintery precipitation during the month. Over the last 88 years of weather recording at this station there have been 41 months of May that have recorded at least some form of wintery precipitation. This year there was just a trace amount, but it was here. The weather finally turned around by May 18 and warmer temperatures and more sunshine finally got everyone thinking we were at long last closer to summer than winter.

March 2019
Third Driest March on Record
By Russell Russ
March can be a month that sees some strong nor’easters that can bring heavy snow or rain or both. March of 2018 was a prime example with three storms that helped push last March’s snowfall total to 43.5 inches. That was not the case this March. While this March was cool and cloudy, it was not a month with much snow or rain. Once again there was a brief warm up in mid-February that fooled everyone into thinking winter was over and spring was here. March’s cool weather slowly but surely brought everyone back into weather reality. This year it was a March reality without much precipitation. Thanks to March’s predominantly cool temperatures, most local lakes and ponds were ice covered until March 28-30. For this winter in Norfolk, pond and lake ice generally came in normally to a little early and went out normally to a little later than normal.
March’s low temperature of minus 6 degrees was observed on March 7 and the high of 64 degrees was observed on March 30. With an average monthly mean temperature of 29.8 degrees, it was 0.9 degree below normal. Temperature-wise it was a very normal March and there were no daily or monthly records set. Over the last twenty years there have been ten Marches that were above normal and ten that were below normal. Norfolk’s warmest March was 2012 with 41.8 degrees, the coldest was 1960 with 21.2 degrees.
The total precipitation for the month was just 1.71 inches. This was 2.69 inches below normal, ranking this March as the 3rd driest in the last 88 years. The result of a month minus any typically occurring March nor’easter storms. Norfolk’s driest March was 1981 with 0.64 inch, the wettest was 1953 with 10.37 inches. Through the first quarter of 2019 the total precipitation amount was 10.79 inches, 1.27 inches below normal. Hopefully this is not a sign of things to come for 2019, but this precipitation total for the year is over 4 inches behind last year’s total through March.
Snow, or more correctly the lack of it, was one of the main weather themes for the month. March’s snowfall total of 11.7 inches was 6.1 inches below normal. Snow totals were down considerably, but overall this March did not even rank in the top 25 for least amount of March snowfall. Everyone must still have had last year’s March snowfall in their minds. Last year’s total was nearly 32 inches higher than this year’s. Norfolk’s snowiest March (and snowiest of any month) was in 1956 with 73.6 inches. March 1946 with a total monthly snowfall of just 0.5 inch holds the record for least amount.
Through the first quarter of 2019 the total snowfall amount was 38.4 inches, 20.7 inches below normal. Compared to the same period last year, this year recorded 41.8 inches less snowfall. The 2018-2019 winter season snowfall total through March was 55.7 inches. This was 27.8 inches below normal and also 40.9 inches less than the same period last winter. April and May still count towards winter snowfall, but it is not looking like either month will add much if anything to this year’s totals.
Unless something very unusual happens it is looking like the 2018-2019 winter snow season will rank as Norfolk’s 11th least snowy winter over the last 88 years. Will April bring springtime to Norfolk? It did, but it did not feel or look very spring-like until April 13 when temperatures final topped 70 degrees for two consecutive days. Through April 21, temperatures were about normal and snowfall was 5 inches below normal. Total precipitation (mostly rain) was already at 4.63 inches, nearly a half inch above normal with over a week left in the month. With plenty of rainfall and a few warmer days pushing things along nicely, spring flowers were blooming, lawns were greening up and the magnolias and forsythia were finally beginning to flower. Spring has arrived.
