
PREVIOUS WEATHER REPORTS
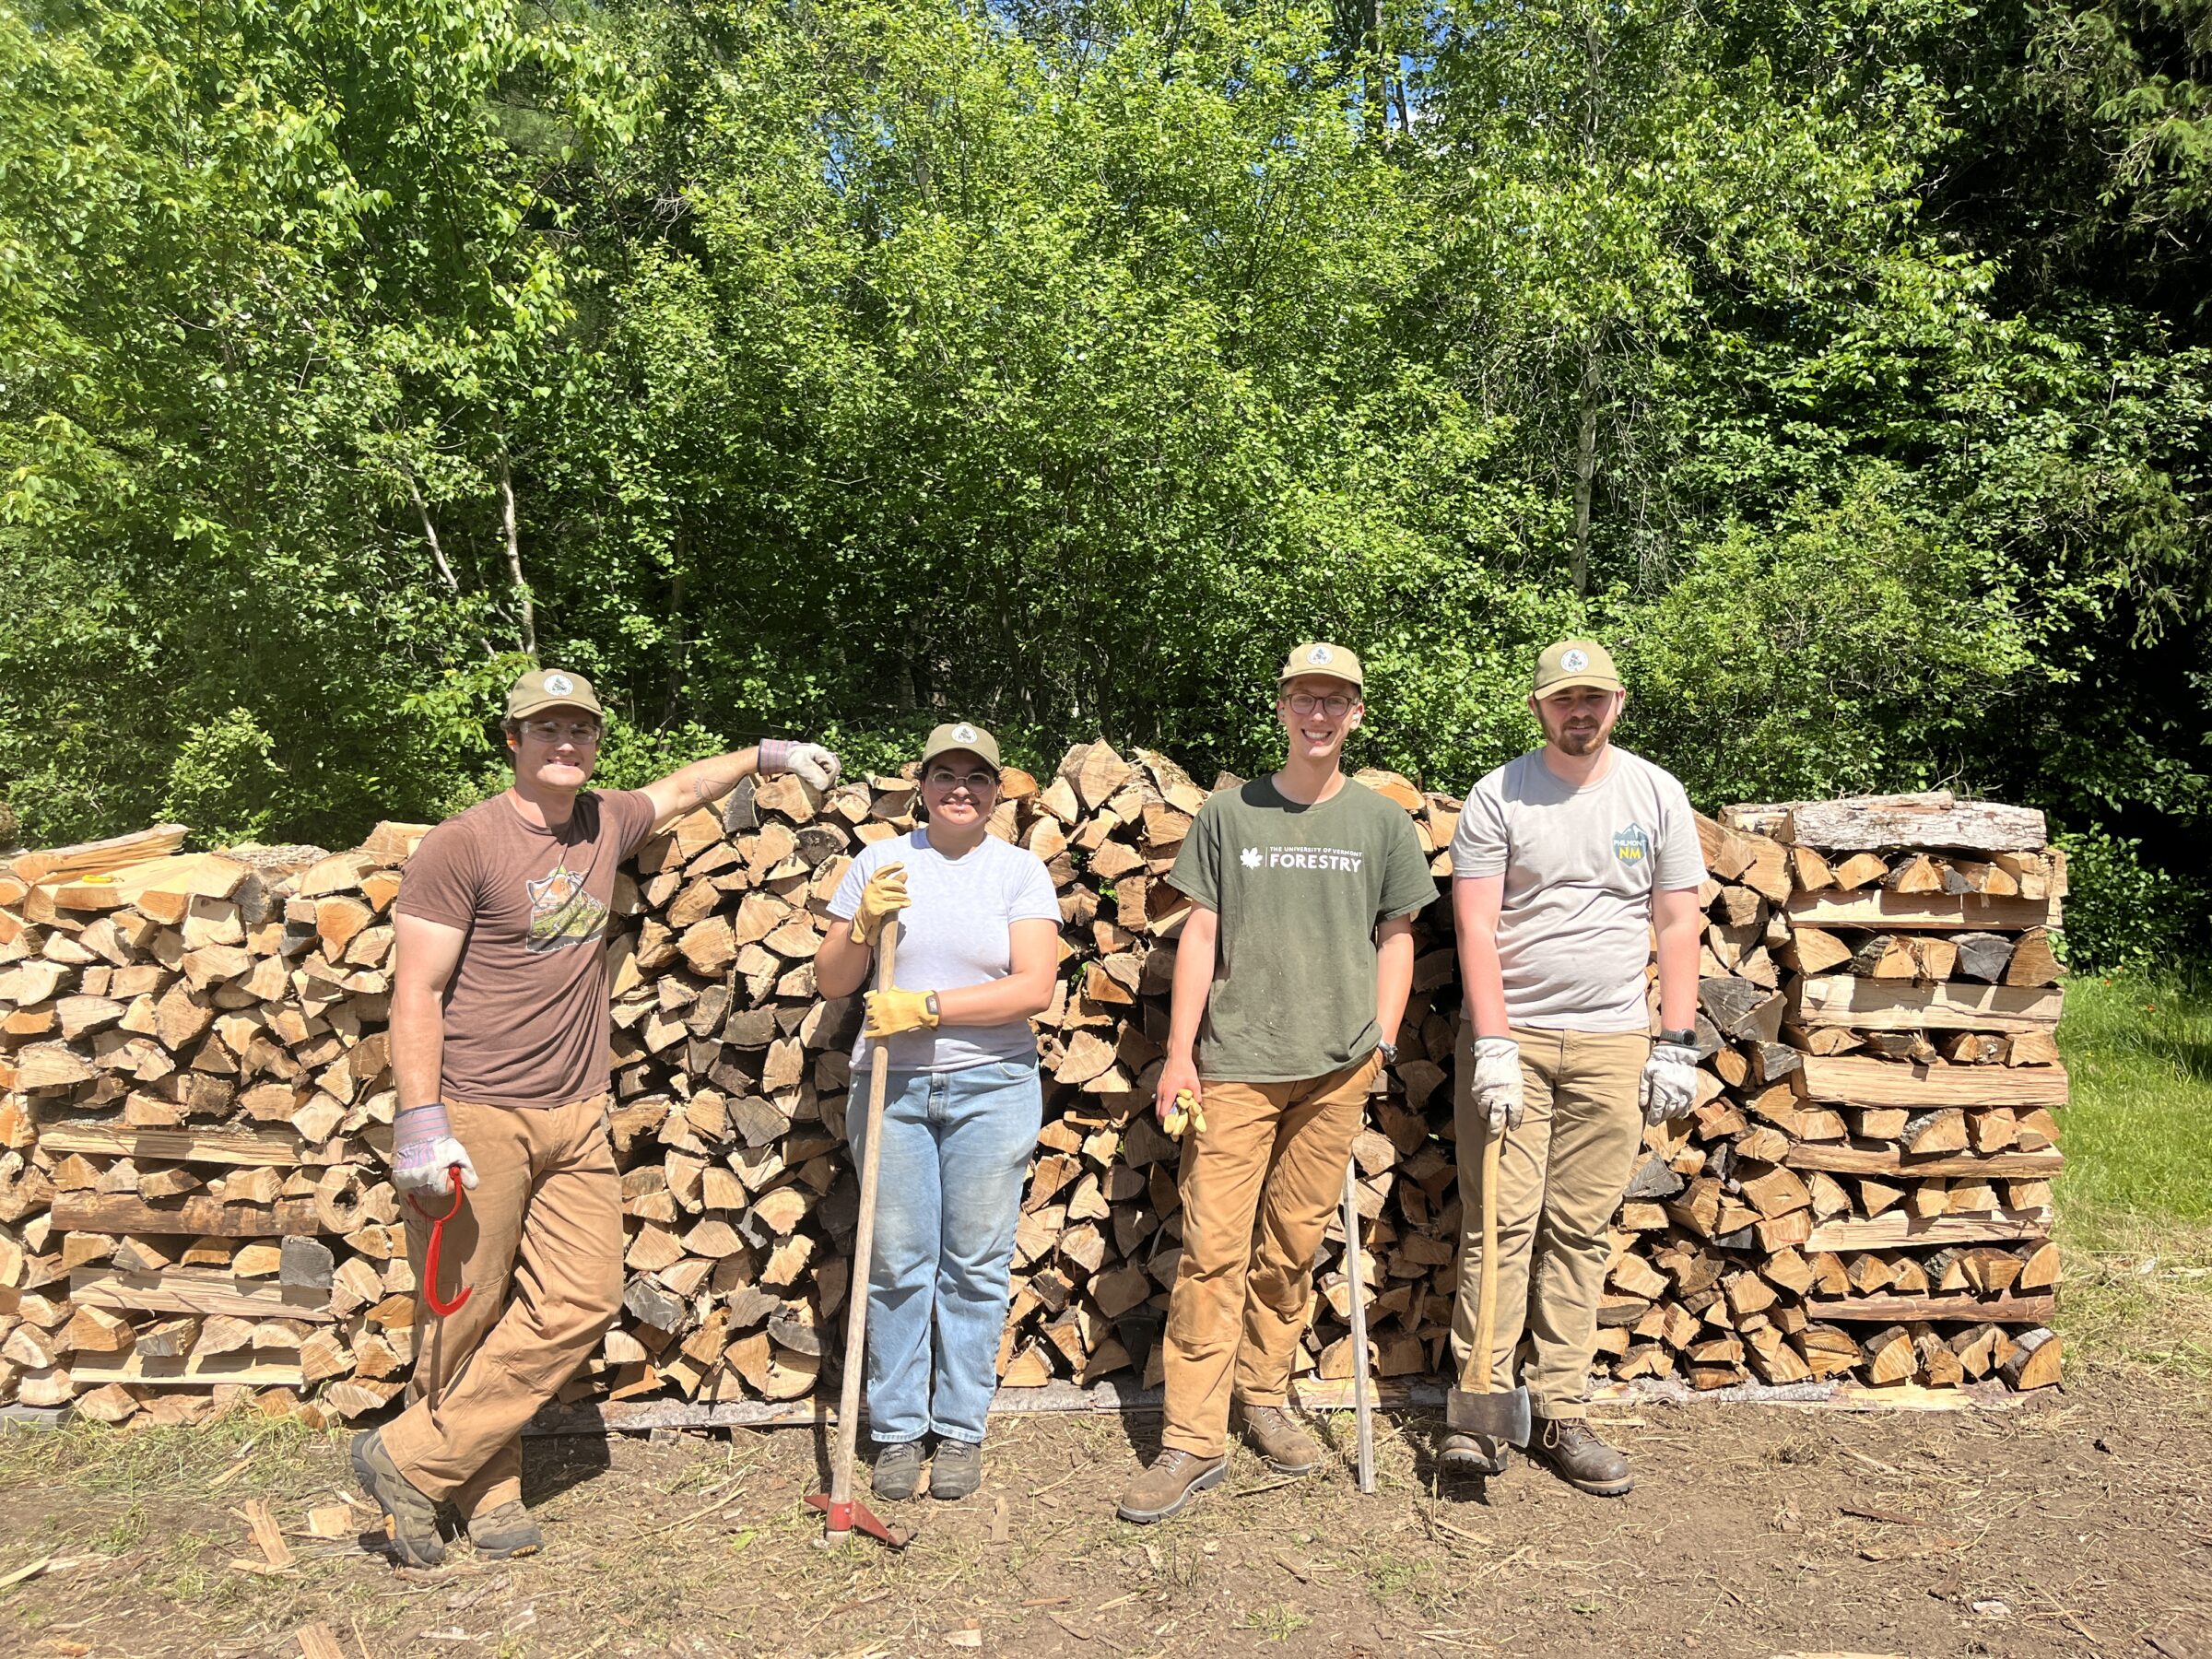
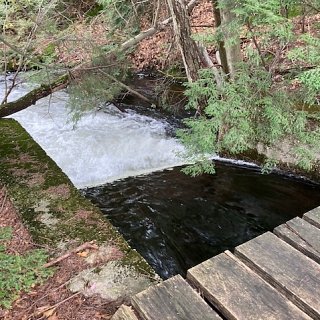
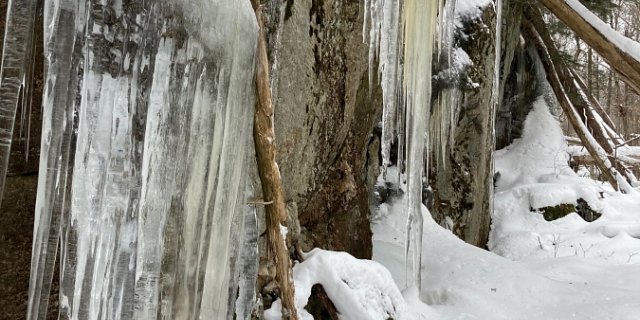
The Next Generation of Land Forest Stewards Take on Great Mountain Forest

Photo courtesy of Kate Regan-Loomis.
Will Watkins, Forester’s Assistant
My name is Will Watkins. I recently graduated from North Carolina State University in Raleigh with a bachelor’s degree in Forest Management. If you recognize my bio at all, it’s because I was an intern here at GMF last summer, and I loved it so much that I wanted to return. This summer I am filling a position as a forester’s assistant, supervising and working with the interns on most of their projects while also getting to go out and complete some individual tasks. One of the reasons that I wanted to come back to GMF was because of how diverse and large the forest is. Even though I was here an entire summer, I only touched the surface of what I could experience at GMF. So, I wanted to come back and discover all I missed and continue some of the work I ran out of time to finish.
In only the first week of being back, we hit the ground running, setting up trail cameras around the forest to monitor wildlife. We have also begun to take inventory of and mark out an old stand of white pine for a thinning. We are thinning to give more space to the best trees in the stand so that they can add more growth around the stem and to allow more light to reach the forest floor. Methods to choose which trees to keep standing and which to take out involve looking at how the spacing of each tree impacts the trees around it as well as the growth form of the trees.

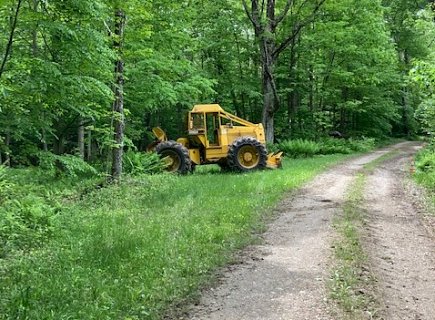
Photo courtesy of Kate Regan-Loomis.
Finn Harris, Intern
My name is Finn Harris, and I am a rising senior at the University of Tennessee Knoxville. There are many aspects of my life that have drawn me to pursue a life in natural resources, but simply put, I have been an avid outdoorsman my entire life and absolutely love being in natural spaces. I often catch myself daydreaming about playing in the woods or in a stream when I’m stuck indoors for too long, so I decided to make my career outdoors.
Throughout my hunt for a summer job, I had been monitoring available positions in New England, as I am eager to learn about a different region of the country and how forestry is done outside of the southeast. Luckily, I was able to land a position on the Great Mountain Forest summer crew!
GMF’s work on forest resilience, supporting biodiversity, protection of watershed resources, and commitment to education and research is important, impactful, and represents ideals that I value deeply. I was further drawn to this position because of GMF’s commitment to exposing interns to lots of different projects and learning opportunities. Considering my future goals are rooted in establishing productive forests to foster ecosystem services and functions, I truly believe my time at GMF will be very meaningful and memorable.

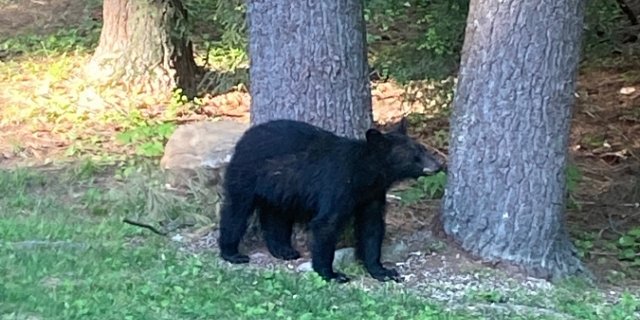
Photo courtesy of Kate Regan-Loomis.
Tim Ostap, Intern
My name is Tim Ostap and I am a rising senior at the University of Vermont pursuing dual B.S. degrees in Forestry and Wildlife and Fisheries Biology. Outside the classroom, I serve as president of the UVM Birding Club and as a board member of the local Audubon chapter.
What draws me most to forestry is the intersection of wildlife conservation and land stewardship, particularly the way active management can benefit both the land and the species that depend on it. Forests are incredibly complex systems, and I am continually fascinated by how a forester’s decisions cascade across an entire ecosystem, shaping far more than just species composition. I have already been surprised by the tree, wildlife, and bird diversity that Great Mountain Forest stewards, and I look forward to discovering more.
I am so grateful to be here this summer. I am excited to contribute to the large-scale inventory plots, participate in the wide array of ongoing research projects, and mark my first silvicultural treatment. GMF offers exactly the kind of hands-on experience that makes everything learned in the classroom feel tangible, and I cannot wait to see what the rest of the summer has in store.
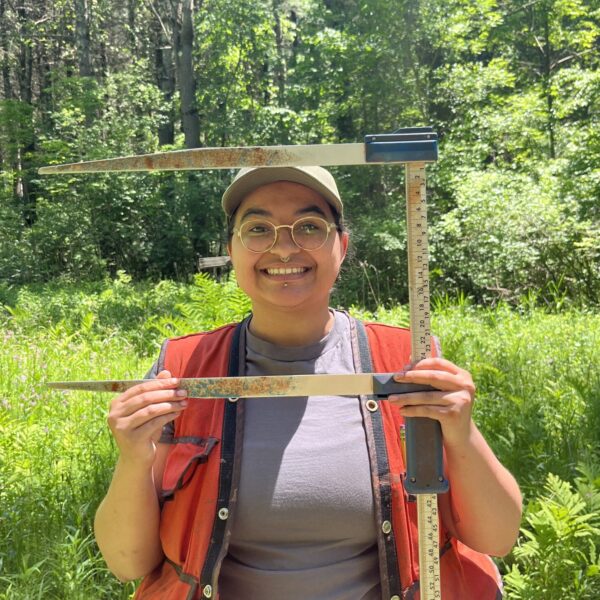
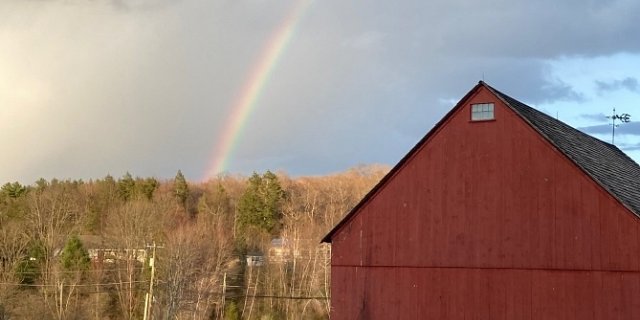
Photo courtesy of Kate Regan-Loomis.
Serenity Zullo, Intern
My name is Serenity Zullo and I’m a student at Paul Smith’s College majoring in ecological forest management with a botany minor. I was born and raised in New York City, specifically the Bronx. I currently reside in western New York near Buffalo and Rochester but
visit the Hudson Valley region often. I always had a love for nature but didn’t grow up knowing about forestry. It wasn’t until I did a landscaping internship at the Woodlawn Cemetery in the Bronx that really solidified my love for the outdoors. My love for nature increased when I decided to go to Paul Smith’s College in the Adirondacks.
I’m currently finding a lot of interest in understory plant identification and management. I’d love to be able to understand a forest through what grows below it. I’m also interested in forest management with a wildlife thought process. I’ve picked up bird watching not too long ago and continued to wonder how forestry might impact specific birds.
I’m very excited to build upon my forestry knowledge and skills with Great Mountain Forest. I’m looking forward to tackling different projects including forest inventory, setting up trail cameras, and more! I’m also looking forward to increasing my knowledge of understory plants in the Great Mountain Forest. I’m thrilled to be working with GMF this summer.
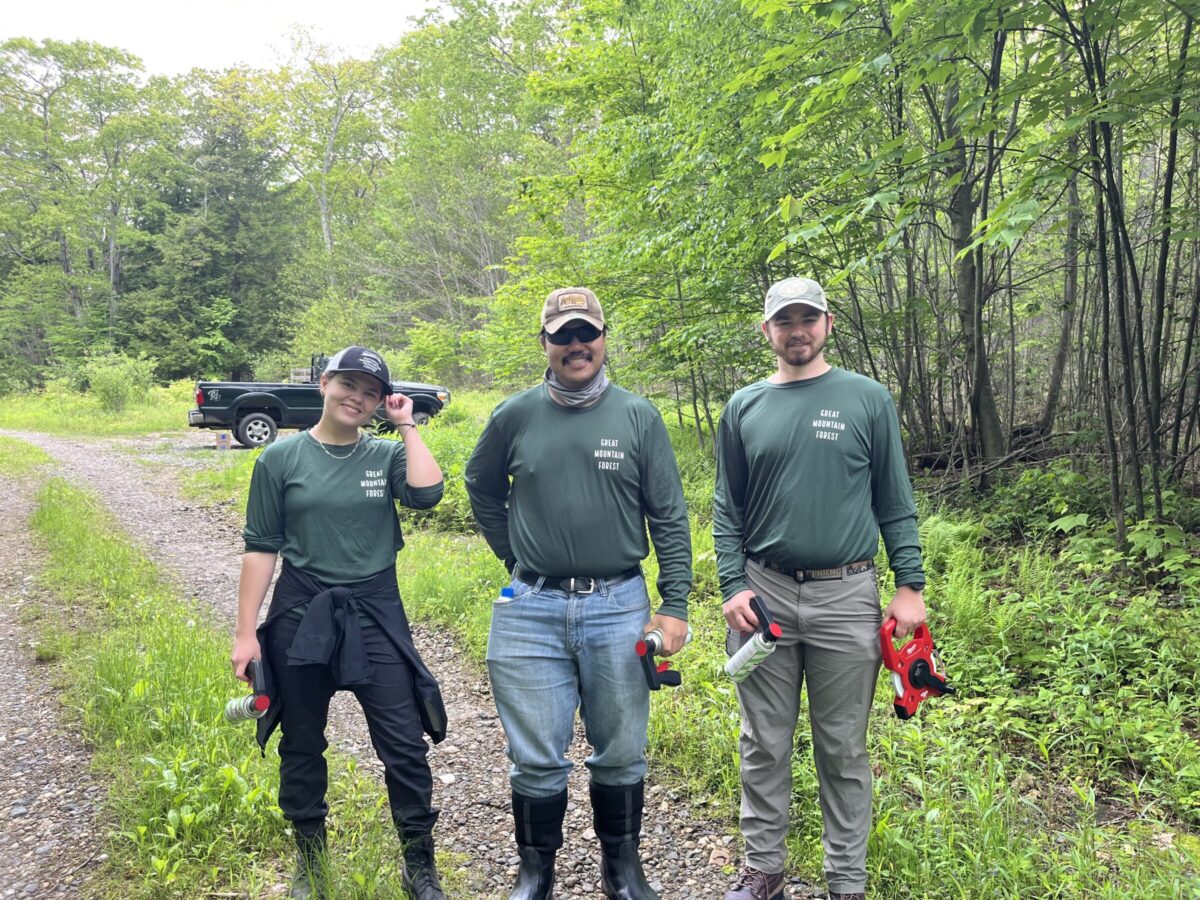
GMF’s 77th Cohort of Forestry Interns
Ren Cattafe
Hello! My name is Ren Cattafe, and I am an undergraduate student at UMass Amherst studying forest ecology and conservation. I grew up in eastern Massachusetts, spending a lot of time in forests, which fostered my love of nature early on and influenced my decision to pursue a career in natural resources. I’m interested in sustainable logging practices, promoting forest resilience through silviculture, and increasing community accessibility and knowledge of forested areas. During my studies I have also had the opportunity to participate in active hemlock woolly adelgid research, which I plan to continue in the coming academic year.
I feel extremely grateful to be working with GMF this summer. Not only has it been an incredible learning opportunity, but a chance to do work that serves a real purpose.

Within the first week, my fellow interns and I supported research that involved marking 30+ acres of trees with the goal of strengthening the dominant cohort and the understory. This experience has enhanced my ability to perceive and interpret forested landscapes in a manner that can’t be achieved in a classroom setting. I am thrilled that such research is supported here, and that both industry and science can coexist within the same space.
Will Watkins
Hello, my name is Will Watkins. I am a rising senior at North Carolina State University studying forest management with a concentration in ecology and a minor in environmental education. I first got into forestry as a degree because I grew up participating in boy scouts and spent a lot of time outdoors. The summer before I started my freshman year at college I was able to go on a special backpacking trip out in New Mexico where I learned about and helped with some forestry and conservation efforts. This inspired me to pursue forestry at school. Now that I have had some schooling and this internship, I know I made the right choice.
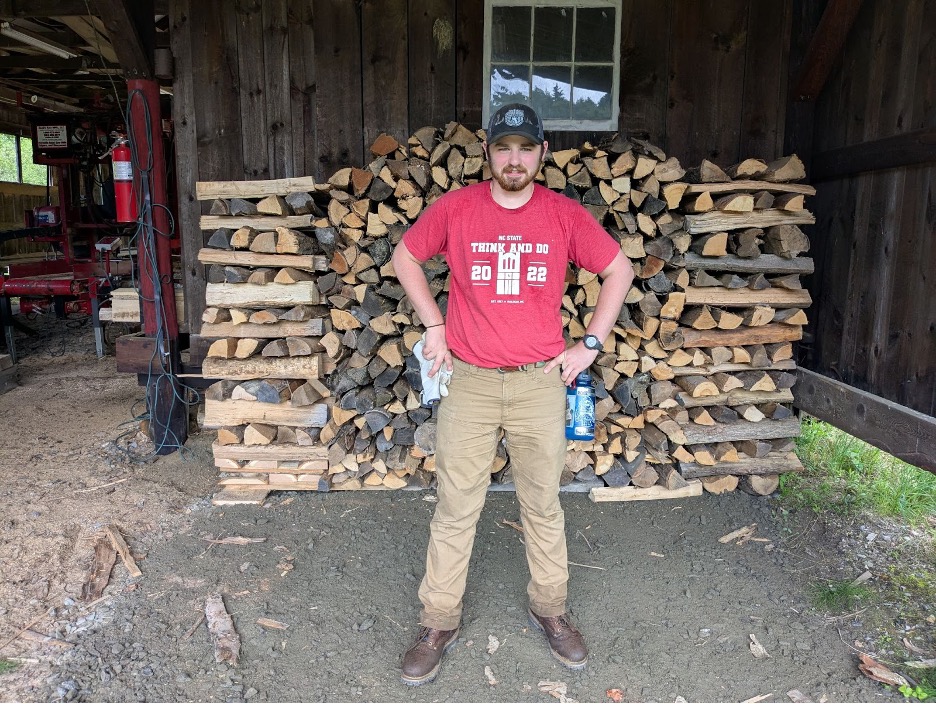
I was born and raised in North Carolina and had never heard of Great Mountain Forest, nor did I know much about the northwest corner of Connecticut. But as soon as I ran across this opportunity online I was excited and applied immediately. It checked all my boxes, plus it was in a part of the country that I have never been to? That’s great! Even now, after working here for a month, I am still slowly learning more about both GMF and the area.
So far, we have marked stands of trees for a pre-commercial thinning and we have made some plots in a stand of barberry to get an inventory of the understory. That is only a small bit of what we have done so far and what we will eventually get to do later in the summer. I am very much looking forward to the rest of the summer.
Ronald Law
Hello, my name is Ronald Law, and I am a 2025 summer intern at Great Mountain Forest. My interest in forestry began quite late in life as I was originally studying computer science. After some time however, my disinterest in the field became apparent to me and I decided I had to quit.

Six months later, I started working at a lawn care company, eventually becoming a tree and shrub specialist. Though I enjoyed my time there, I slowly came to realize the elements in our environment that were changing dramatically, resulting in the death and weakening of numerous plants under my care. As unusually warm winters became the norm, and invasive pests became more prevalent, I realized I wanted to work in a position that was more proactive than reactive when it came to the health of our environment. So I decided to return to school and pursue environmental studies, which eventually led me to my internship at Great Mountain Forest.
August 2021
Another Warm and Wet Month
By Russell Russ
August’s weather for Norfolk was greatly affected by hurricanes and tropical storms. Not storms that made Connecticut landfalls, but storms that struck in the Gulf Coast region and just to our east in Rhode Island. The remnants of these once dangerous storms mostly lost their punch by the time they made it to our state, but they still brought considerable rain to the region. There was little wind damage here, but the rain seemed relentless and there were flooding concerns. August had an abundance of cloudy, but also humid days. No record high temperatures were set this month. Overall, it was warmer than normal and like July was wetter than normal.
August’s low temperature of 49 degrees was observed on August 1 and the high of 89 degrees was observed on August 12. The monthly mean temperature of 69.8 degrees was 3.4 degrees above normal. It did not seem like it was that warm, but this August was Norfolk’s 6th warmest August over the last ninety years. Norfolk’s warmest August on record was in 2001 with a temperature of 71.0 degrees. The coolest August on record was in 1964 with 61.5 degrees.
The total precipitation recorded for the month was 6.33 inches, 1.73 inches above normal. This August was Norfolk’s 11th wettest August on record. Norfolk’s wettest August, and wettest month of any month, was in 1955 with 23.67 inches. One cannot write about August rainfall totals without mentioning The Flood of ’55 that hit this area so hard back in August 1955. Norfolk’s driest August was in 1953 with just 0.65 inch, which was also Norfolk’s fifth driest month of any month. The month of August can have big swings for precipitation amounts. What we experienced this summer was that not only can hurricanes and tropical storms (or the lack of them) really affect our summer rainfall totals, but the remnants of these storms can also play a large role.
Through August, the total precipitation amount for the year was 39.78 inches, 5.43 inches above normal. By comparison, this was 15.27 inches more than last year’s total through August. The summer of 2020 was a dry one. The summer of 2021 has been the opposite. Last summer the talk was all about the drought, this year it is all about the excessive rainfall.
September brought more of the same for weather in Northwest Connecticut. Remnants of another hurricane that made landfall in the Gulf Coast dumped 4.34 inches of rain on Norfolk during the first two days of the month. It was then fairly dry for a few weeks until a slow moving cold front produced 3.28 inches of rain in a short period of time. Both measurements were 24-hour rainfall totals. That is impressive. By September 25, the monthly rainfall total of 8.52 inches was already 3.85 inches above normal. Another wetter than normal month for Norfolk. Through two-thirds of the month, temperatures were running on the warm side and there was no talk of frost. Yes, frost can occur in September in the Norfolk area. Fall foliage was quite noticeable by mid-September. The sugar maples seem to be having an off year, likely due to the excessive rainfall. The leaves have begun their color change and it will not be long before the weather finally follows suit and turns more fall like.

July 2021
Wettest July on Record
By Russell Russ
On average, July is Norfolk’s warmest month of the year. July of last year was the warmest July, and also the warmest month of any month, on record for Norfolk. July of this year might technically end up being the warmest month of 2021, but it sure did not feel like it. The month started out cool and rainy and the rain did not stop for the rest of the month. Norfolk’s weather for its Independence Day Weekend was about as nice as its Memorial Day Weekend. Neither had particularly nice weather. The high temperature of 58 degrees on July 3 was the same as the high temperature recorded last Christmas. Both dates do not typically hit 58 degrees, at least in Norfolk. The big storyline for July’s weather this year was not temperatures, it was rainfall.
July’s high temperature of 86 was observed on July 7 and the low of 48 was observed on July 31. The average monthly mean temperature of 67.6 degrees was 0.7 degrees below normal. Not high ranking for cool months of July, but it was the first month of 2021 that came in below average for monthly temperature. The warmest July was in 2020 with 73.1 degrees and the coolest was in 1962 with 63.9 degrees. This July’s persistent cloudy and rainy weather definitely had an effect on its temperatures.
The total precipitation recorded for the month was 13.05 inches, a whopping 8.72 inches above normal. Norfolk’s average July total is 4.33 inches. Rainfall was observed during the first fifteen days of the month. A dreary start. At month’s end, twenty two of the month’s thirty one days had observed rainfall during part or all of them. Perhaps fortunately, there were no direct hit huge storm events like a hurricane or tropical storm. The rainfall was just persistent and often reached two to four inches over a few day span several times during the month. As a result, there were no major local flooding issues. There were, however, some issues caused by the excessive and persistent amount of rainfall that occurred all month. With no dry out period, streams and rivers stayed fairly full and the ground stayed saturated for most of the month.
On the plus side, the running yearly precipitation deficit of 5.02 inches after June was transformed into a surplus of 3.70 inches after July. There should be no talk of drought conditions around Norfolk, or the Northeast U.S. for that matter, for quite a while. Perhaps all of the “we need rain comments” from earlier in the year came back to haunt us during July. Through July, the 2021 total precipitation amount of 33.45 inches was 3.70 inches above normal. The average yearly total precipitation amount for Norfolk is 52.53 inches. Total precipitation includes rain, snow and sleet.
An early look at August’s weather through mid-month showed a continuation of July’s mostly cloudy conditions. Norfolk fortunately saw a bit of a dry out period during August’s first two weeks. There were a few days with typical hot and humid summer weather, but all in all, temperatures and rainfall were running about average for the first half of the month. Looking ahead, there were some tropical storms and hurricanes brewing in the Atlantic, as usually occurs during August. The latter half of the month could get interesting weather-wise.
June 2021
Nice Summer Weather
By Russell Russ
As it was last year, June was a very pleasant summer month for weather in Norfolk. Temperatures were on the warm side and there were many clear, sunny days without too much humidity. There was rain scattered throughout the month, but Norfolk didn’t see much for rainfall totals even when it did rain. Parts of the state, and the Northeast in general, did get a decent amount of rainfall in June. The storms producing higher rainfall totals just kept missing Norfolk this month. It was on the dry side, but not dry enough to cause browning of lawns or dried out gardens.
June’s low temperature of 41 degrees was observed on June 1 and the high of 91 was observed on June 29. An impressive fifty degree temperature differential. With an average monthly mean temperature of 66.8 degrees it was 3.4 degrees above normal. This June was tied with June 1999 as the fourth warmest June over the last 90 years. There were two days this month that reached 90 degrees or higher; June 29 recorded 91 and June 30 recorded 90. Norfolk gets to 90 or above on average about two or three times a year. There were two days with daily record high temperatures this month; June 6 with 87 degrees (was 85 in 1934) and June 7 with 88 (tied the 2008 record). Norfolk was close to daily record highs on June 5, 8, 27, 28 and 30. The highest temperature ever recorded at this weather station was 101 degrees, it occurred on June 29, 1933. Norfolk’s warmest June was in 1943 with 68.3 degrees, the coolest was in 1958 with 58.8 degrees.
The total precipitation recorded for the month was just 2.01 inches, 2.80 inches below normal. It was Norfolk’s ninth driest June over the last 90 years. The driest June was in 1988 when only 0.61 inch was recorded. The wettest June was in 2013 with 13.38 inches. There were four relatively small thunderstorms this month, occurring on three days. The largest storm rainfall total was 1.12 inches, occurring during the morning of June 14.
For the first half of 2021, Norfolk’s total precipitation amount was 20.40 inches. This was 5.02 inches below normal though the month of June. A five inch deficit is not too bad yet and fortunately there currently are no widespread drought concerns here in the Northeast. Let us hope that things turn around a little for Norfolk and we pick up more beneficial rainfall in the coming months. A few summer thunderstorms can help bring up the total in a hurry.
An early look at July showed that we most certainly made huge gains towards reducing our yearly precipitation deficit. In fact, during the first three weeks of the month our deficit was changed to a surplus. The normal monthly rainfall amount for July is 4.33 inches. By July 22 this year the total was already a whopping 11.74 inches. With a week and a half yet to go, July 2021 was already the second wettest July over the last 90 years. Another inch or so will make this July the wettest on record.
For the first nineteen days of July, rainfall occurred on eighteen of them. Not surprisingly with all of the rainy weather, temperatures were running a little below normal for the first three weeks of the month. July 2020 was the warmest on record, could July 2021 be the wettest? Stay tuned.
May 2021
Highly Ranked for Rainfall
By Russell Russ
May started out cooler than normal and through mid-month was very much on the cool, cloudy and rainy side. The raw feel made many people wonder where early summer was. Conditions changed towards the middle of the month with warmer temperatures and sunnier skies. That was right up until Memorial Day Weekend, the unofficial start of summer. It was a very cool and wet weekend, perhaps some of the worst weather we have seen here for Memorial Day Weekend in a long time. A wind chill of 30 degrees and nearly two inches of rain on May 29 put a damper on many planned outdoor activities. But, we needed the rain, right?
May’s low temperature of 33 degrees was observed on May 1 and the high of 86 degrees was observed on May 26. With an average monthly mean temperature of 55.0 degrees, it was just 0.1 degree above normal. There were no record daily temperatures this month. Norfolk’s warmest May occurred in 2015 with a temperature of 61.8 degrees, the coldest was in 1967 with 46.8.
The total precipitation recorded for the month was 7.75 inches, 3.41 inches above normal. This was the first month of 2021 that was above average for total precipitation. This May had reached its normal amount for precipitation by about May 26, then we received nearly another four inches during the following several days. It ended up being tied with 1940 as Norfolk’s fourth wettest May over the last 90 years. It took a big bite out of 2021’s precipitation deficit. Through May, the total precipitation for 2021 was 18.39 inches, now just 2.22 inches below normal for the year. Norfolk’s wettest May was in 1984 with 12.34 inches, the driest was in 1980 with 1.31 inches.
Although it felt cold and raw enough for snow on many days, there was no snowfall recorded this May. This was 0.4 inch below normal, but there have been many Mays without any snowfall. Norfolk’s winter season snowfall total for 2020-2021 ended up being 77.6 inches, 11.5 inches below normal. Norfolk’s 2021 snowfall total through May was 53.5 inches, 11.3 inches below normal. February’s snowfall of 35.0 inches makes up a majority of these snow totals. Norfolk’s (and Connecticut’s) snowiest May on record (by far) was in 1977 when an amazing 20.0 inches was recorded.
An early look at June’s weather through mid-month shows that temperatures were running about two degrees above normal. Precipitation was below normal, but a good thunderstorm or two can go a long ways towards increasing monthly and yearly totals. By June 15, Norfolk had observed three June thunderstorms. Two thunderstorms occurred on June 14, and while short in duration, they both came with some wind, numerous lightning strikes and some brief heavy rainfall. Summer has arrived in Norfolk.
April 2021
Spring Arrives
By Russell Russ
April can have traits of both winter and spring. March was unusually pleasant with hardly any snow. April followed that with some warmer temperature, as would be expected, but April also had more snowfall, more rainfall, and more cloudy days than March. Even with some snow and many cloudy days, spring did arrive in Norfolk as it usually does in April.
One day this April stood out for being quite wild for weather. On April 21 it was 34 degrees in the morning, by early afternoon it was 63 degrees. Then a strong cold front with a tornado warning label came through at about 3:00 pm. Norfolk only recorded 0.16 inch for rainfall, but there was brief pea-sized hail. This cold front did produce two small tornados in Kent, CT and Amenia, NY. In Norfolk the temperature dropped 21 degrees in 25 minutes and by 5:00 pm with temperatures in the low 30’s there were snow flurries in the air. Overnight into the next morning Norfolk was blanketed with nearly an inch of snow.
April’s low temperature of 17 degrees was observed on April 3. This tied the 1978 record daily low for that date. The high of 77 degrees was observed on April 28. There were no daily record high temperature in April. With an average monthly temperature of 45.4 degrees, it was 2.3 degrees above normal. This April was tied with 2012 and 2019 as Norfolk’s 20th warmest April over the last 90 years. Norfolk’s warmest April was in 2010 with 49.4 degrees and the coldest was in 1943 with 36.8 degrees.
With 90 years of weather observing for the month of April, over the last 20 years there have been five April’s ranked in the top ten for warmest Aprils. Over the last 20 years there has been one April ranked in the top ten for coldest.
The total precipitation recorded for the month was 2.87 inches, 1.41 inches below normal. Through April, the total precipitation for the year was 10.64 inches, 5.63 inches below normal. Norfolk’s wettest April was in 1983 with 10.79 inches, the driest was in 1941 with 1.15 inches. April’s snowfall total was 6.0 inches, just 0.1 inch below normal. Although it seemed to be a snowy April, it really was near normal. There have been many Aprils with no snowfall or just a trace of snow, the snowiest April was in 1997 with 31.1 inches.
Through April, the 2021 calendar year snowfall amount of 53.5 inches was 10.9 inches below normal. The 2020-2021 winter season (October-April) snowfall total of 77.6 inches was 11.1 inches below normal, about in the middle of the pack for seasonal snowfall over the last 90 years. Norfolk’s snowiest season was in 1955-1956 with 177.4 inches, the least was in 2015-2016 with just 35.5 inches.
A look ahead at May’s weather through mid-month showed that temperatures were running about six degrees colder than normal. It was a cool and cloudy first half of May. By the third week of the month it did warm up and a few days with temperatures in the 80’s helped bring the monthly average up to near normal. There was no snowfall, but there was a decent amount of rain for a change. As usual, this may carried Norfolk from a brown spring look to a green summer look in the span of a few weeks.
March 2021
Record Least Snowfall for the Month of March
By Russell Russ
An accurate description of March’s weather would certainly be unusual. March weather was high ranking for temperature, lack of precipitation and it topped the rankings for least snowfall. If you were looking for sunny skies, warm temperatures and hardly any snow, then March was your month. March is not typically described in this way. After a very traditional cold and very snowy February, it was quite the rebound for March to come in so pleasant. As can happen in March though, there were many windy days. This March had more than its fair share of wind. Nothing too dramatic, just an abundance of windy days (and nights).
All local ponds and lakes lost their ice by the third to fourth week of the month. Tobey Pond and Wangum Lake both went out during the day on March 26. The ice-out dates this year were about average for the last twenty years. The lack of a real January thaw and February’s cold and snow helped make the ice thicker this year than it has been in recent years. The thicker ice also likely contributed to it staying longer this year than in recent years. Smaller ponds formed ice, and kept it, by December 15 (about average), the larger water bodies did not ice over until January 10-12 (a little later than average).
March’s low temperature of 7 degrees was observed on March 2 and the high of 72 degrees was observed on March 26. Two new record daily high temperatures were set this month; a high of 71 on March 25 (was 66 in 1987) and a high of 72 on March 26 (was 68 in 1945). With an average monthly temperature of 34.2 degrees, it was 3.5 degrees above normal. This March was tied with March 1991 as Norfolk’s sixteenth warmest March over the last 90 years. Norfolk’s warmest March was in 2012 with 41.8 degrees, the coldest was in 1960 with 21.2 degrees.
The total precipitation recorded for the month was 2.24 inches. This was 2.10 inches below normal. It was Norfolk’s tenth driest March and makes for the third month of 2021 that was below normal for total precipitation. Norfolk’s driest March was in 1981 with 0.64 inch, the wettest was in 1953 with 10.37 inches. Through the first quarter of 2021, the total precipitation amount was 7.77, 4.22 inches below normal. Once again, a deficit is slowly growing.
The lack of snowfall was this month’s big surprise. March’s snowfall total of just 0.1 inch was 17.4 inches below normal and ranks this March as the least snowy March on record. The old record was 0.5 inch from March 1946. The March with the most snowfall, also the snowiest month of any month on record for Norfolk, was in 1956 with 73.6 inches.
Through the first quarter of 2021, the total snowfall amount was 47.5 inches, 10.8 inches below normal. The 2020-2021 winter season (October-March) snowfall total through March was 71.6 inches. This was 11.0 inches below normal. February’s snowfall contribution of 35.0 inches produced nearly half of this season’s snowfall.
Through April 20, April was looking fairly normal for temperature, precipitation and snowfall. A 4.6 inch snowfall on April 15-16 was a surprise, but April’s average monthly snowfall amount is 6.1 inches, so spring snow does happen regularly here in Norfolk. Snow can also happen in May here in the Icebox of Connecticut and because of this, the season snowfall total will not be finalized until the end of May.

February 2021
An Abundance of Snowfall
By Russell Russ
February was a snowy month. After several years of rather soft winter weather in what is typically wintertime, it seemed as if this February was so much colder and so much more snowy than normal. In fact, it was rather normal temperature-wise, but there was more snowfall than average. Not record setting snowfall by any means, just more than average. Plus, with the more normal wintertime February temperatures, what snow we got, stayed on the ground for the entire month. It was a good old fashioned winter month. This made for happy people looking to ski, skate or go ice fishing and generally anyone else that enjoys snow and typical Norfolk winter weather.
The month’s low temperature of 4 degrees was observed on February 12. There were five days this month with single digit temperatures, but no days recording zero or below zero. The high temperature of 46 degrees was observed on February 24. There were no daily record high or low temperatures this month. The average monthly temperature was 22.8 degrees, just 0.6 degree above normal. It was the coldest February in Norfolk since 2015. February 2015’s average temperature of 10.9 degrees was Norfolk’s second coldest month of any month since 1932. The warmest February on record was in 2002 with 30.7 degrees. The coldest was in 1934 with 9.0 degrees, making that also the coldest month of any month as recorded at this weather station.
Total precipitation recorded for the month was 3.42 inches, just 0.21 inch below normal. A vast majority of February’s precipitation was in the form of snow, with a small portion coming as freezing rain. Obviously, the month’s cold temperatures played a role in this predominately frozen winter precipitation. The 2021 calendar year (January and February) total precipitation amount of 5.53 inches was 2.12 inches below normal. The record for most February total precipitation is 11.70 inches from 1981, the least amount is 0.60 inch from 1987.
February’s monthly snowfall total of 35.0 inches was 14.7 inches above normal. Snow on ground depth during the month ranged from 9 inches to 21 inches, with an average snow on ground of over 17 inches during the month. This month ranked as Norfolk’s eleventh snowiest February over the last 90 years. It was the snowiest February since 2014, then 2010 before that, then 1972 before that. Norfolk’s top seven snowiest February’s occurred between 1940 and 1972. The record for most snowfall in February is 52.4 inches from 1969, the least is 4.8 inches from 1998.
The 2021 calendar year snowfall total through February was 47.4 inches, 6.6 inches above normal. This is over 33 inches more snowfall than the same period last winter. The snowfall total for this winter season, October through February, was 71.5 inches, 6.1 inches above normal for this time period. This is over 31 inches more than last winter season for this time period. Hence, the happiness of the area’s snow loving crowd, from those that try to make a living from snow to those that just play in it.
March is often Norfolk’s transition month between winter and spring. March is a fickle weather month and can throw a wild mix of weather conditions at us. This March through mid-month was much colder than normal with minimal precipitation and minimal snow. It was certainly cold enough for snowfall, but the storms just did not form. The cold kept February’s snow on the ground in most places at least through mid-month. Many local maple syrup producers have reported that this season has been slow due to the cold temperatures. That may change as the forecast for the last quarter of March is for temperatures to increase. Precipitation is needed, so hopefully the warmer conditions also bring some beneficial early spring moisture.

January 2021-Part 2
Winter Returns
By Russell Russ
The year of 2020 was Norfolk’s fourth warmest year on record and October through December were all above normal for temperature. Snowfall for the current winter season, however, was about normal through December. What would this mean for January? As it turned out, January was a little warmer than normal and snowfall was below normal, but there was frequent wintry precipitation and there were some cold temperatures. Winter had arrived, perhaps a little soft, but it arrived.
January’s average temperature of 22.9 degrees was 2.1 degrees above normal. It was five degrees colder than January 2020. There were no daily record temperatures this month, but there were four days with single digit temperatures and one day recorded a low of 2 below zero. January’s warmest temperature was a high of 39 degrees on January 2. In all of 2020 there were seven days with single digit temperatures and the low all year was zero. Winter just might have found its way back to Norfolk. Norfolk’s warmest January on record was in 2002 with an average temperature of 31.7 degrees and the coldest was in 1982 with 11.7 degrees.
January’s total precipitation of 2.11 inches was 1.93 inches below normal. The wettest January occurred in 1979 with a total of 11.77 inches and the driest was in 1970 with just 0.74 inch. The monthly snowfall total of 12.4 inches was 8.3 inches below normal. Of January’s thirty-one days, there was some sort of precipitation that fell during sixteen of those days. Only a small portion of the precipitation was plain rain, most was in the form of snow. There was at least three inches of snow on the ground for twenty-eight days during January, with depths ranging from three to eight inches. The snowiest January occurred in 1987 with 50.5 inches. Coming in at second snowiest was January 2011 with 50.0 inches. The least snowy was in 1980 with just 2.6 inches.
The 2020-2021 (October-January) winter season snowfall total through January was 36.5 inches, 8.5 inches below normal. It has not been super winter-like, but it has seemed like a more normal winter than we have experienced in Norfolk for the last few years.
A look at February’s weather through mid-month showed that snowfall and cold temperatures were the norm. Norfolk was seeing a good old fashioned winter. By February 9, we had already exceeded our average snowfall amount for the entire month. By February 16, temperatures were running about two degrees below normal and we were nearly 3.5 inches above normal for snowfall, with more snow in the forecast for later in the month. Unlike previous years when the winter storms seemed to skirt the region, this winter we are getting the storms and on a fairly regular basis. We are not breaking any snow or cold records so far this winter, it is just normal winter for Northwestern Connecticut. Snow lovers had lost their faith over the last two years. It seems that their faith may be restored, as of February anyway.
