
PREVIOUS WEATHER REPORTS
September 2016
Drought Conditions Continue
By Russell Russ
Our last few Septembers have been weather record setters. In 2014 it was the driest and in 2015 it was the warmest. The warm and dry conditions that we have seen all summer long continued through September this year. The warmth lasted well into the third week of the month when finally some more seasonal cooler temperatures arrived. By late in the month there were at least a couple of days when lower lying areas did see some frost, but no frost was observed at the weather station this month.
September’s high temperature of 82 degrees was observed on September 8 and the low of 36 was observed on September 26. The average mean temperature was 62.5 degrees, 3.7 degrees above normal.
There were no daily temperature records set this month, but overall it was tied with September 2007 as being the sixth warmest September in the last 85 years. The five warmest Septembers on record for the station’s 85-year history are: 2015 with 64.7, 1961 with 64.6, 2001 with 64.0, 2011 with 63.1 and 2005 with 62.9.
The near record warmth is newsworthy, but the big weather story for our region continues to be the lack of rainfall. There was just one thunderstorm observed at the station this month. Several storms just missed hitting Norfolk which has been the case all summer long – and really all last summer as well. The rainfall total for September was 2.39 inches. While not even in the top ten for driest Septembers it was 2.29 inches below normal. This monthly deficit added to our ever increasing yearly precipitation deficit.
Through September this year, the total yearly precipitation amount was 28.21 inches. This is 11.04 inches below normal and even 3.64 inches less than last year’s total through September. The year of 2015 was pushing to be in the top five driest years, it ended up being the seventh driest. It appears that 2016 has its sights set on being the driest on record.
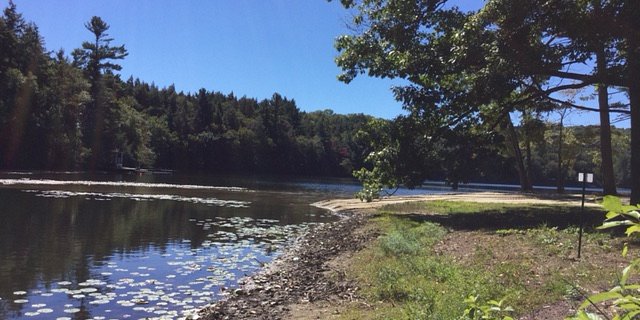
What will October’s weather be like? As of October 20, the monthly temperature was nearly five degrees above average and the rainfall total was a meager 0.45 inches, 3.85 inches below normal. The deficit is really showing its affects. Wells are going dry and many local lake and pond levels are as low as anyone can remember. Other parts of the U.S. are seeing record rainfall amounts, but here in the Northeast it is completely the opposite. Unless conditions change drastically in the next two months, 2016 has a strong chance to be one of the top three driest years Norfolk has seen in at least 85 years – and maybe even the driest.
August 2016
Second Warmest August on Record
By Russell Russ
August was another warm and sunny summer month for Norfolk. If you like warm, sunny weather with little rain, then this summer has to rank way up there near the top for beautiful weather conditions. August of 2016 was very similar to August of 2015, except this year it was a little warmer and a little wetter—yes, wetter this August.
August was near normal for rainfall, but the continuing deficit is a growing concern for our region. According to NOAA, by late August, Norfolk, most of Connecticut and a good portion of New England were all experiencing some form of drought. Norfolk itself was classified as being in a condition of moderate drought.
The month’s high temperature of 90 degrees was observed on August 13. The low of 48 degrees was observed on August 23. The monthly average mean temperature was 70.2 degrees, 3.9 degrees warmer than normal. At the weather station this summer there were two days at or above 90 degrees, July 22 and August 13. This is about average for Norfolk, but the last previous 90-degree day was in 2013.
There were no daily temperature records set this month, but it was the second warmest August and also the thirteenth warmest month of any month over the last 85 years. Norfolk’s warmest August was in 2001 with an average temperature of 71.0 degrees.
The total precipitation recorded for the month was 4.51 inches, 0.12 inches below normal. It was near normal for rainfall, but the month did add to our yearly precipitation deficit. Through August, the total precipitation amount for the year was 25.82 inches. This is 8.75 inches below normal.
Last summer we were talking about how dry it was and that it could be a record dry year. In fact, 2015 was a dry year, the seventh driest on record for Norfolk. This year we are 2.03 inches drier than we were through August last year. It could be another top ten or even top five finish unless we pick up some much needed rainfall in the coming months.

July 2016
Sunny and Warm
By Russell Russ
July is typically the warmest month of the year for Norfolk and this year was no exception. With a majority of warm and sunny days it was a very nice summer weather month. The downside of that is our increasing rainfall deficit. We are getting just enough rain to stay out of major drought conditions, but for six of the seven months of this year we have seen below average precipitation.
July’s low temperature of 51 degrees was observed on July 20 and the high of 90 was observed on July 22. This was our first day to hit the 90 degree or higher mark since July 19, 2013. With an average monthly temperature of 70.9 degrees, it was 2.8 degrees above normal.
This July was tied with July 1994 as being our sixth warmest July and seventh warmest month of any month over the last 85 years. Compared to July 2015, this July was two degrees warmer, but we did get about a half inch more rain this year.
The total precipitation recorded for the month was 3.01 inches, 1.35 inches below normal. There were just two thunderstorms observed at the station this month and as has been the case all summer long, nothing on the severe side.
Through July the total precipitation amount for the year was 21.31 inches. This is 8.63 inches below normal. Last year was dry, but we are now even 4.59 inches drier than that.
What will August’s weather be like? Through the first half of the month it was warm with numerous hazy, hot and humid days. Typical summer weather. On the plus side, August has brought some much needed rainfall. If that continues then our rainfall deficit should not be increasing by much. Over the next month we will be making our transition into cooler autumn conditions.
June 2016
A Growing Rainfall Deficit
By Russell Russ
June was a dry month. In fact, it was tied with 1984 as Norfolk’s seventh driest June over the last 85 years. Last year’s June, in contrast, was the fifth wettest June on record and was the wettest month in 2015. This year, the June rainfall amount is so far our least for any month of 2016.
June began cooler than normal. An unusual span of numerous breezy and windy days made it feel even colder than it really was. After mid-month, the winds died down and temperatures became more normal. The lack of significant rainfall lasted the entire month.
June’s low temperature of 42 degrees was observed on June 11 and the high of 86 degrees was observed on June 19 and 26. With an average monthly temperature of 64.9 degrees, it was 1.6 degrees above normal. The high of 86 on June 19 tied the 1957 daily high temperature record for that date.
The total precipitation recorded for the month was 1.59 inches, 3.31 inches below normal. There were just two thunderstorms observed this month, but as it has been all spring and summer, nothing on the severe side. The driest June was in 1988 when only 0.74 inch was recorded. Our wettest June was in 2013 when 13.38 inches were recorded.
For the first half of 2016, January through June, our total precipitation amount was 18.30 inches. This left us with a precipitation deficit of 7.28 inches. By early June a moderate drought advisory was issued for most of the state. We certainly need the rain, but it’s hard to malign beautiful, sunny weather in the summertime.
Last year May was very dry and June was very wet. This year June was very dry, so will that mean that July will be very wet? We had already exceeded June’s rainfall amount by mid-July, but we still have a long way to go.

May 2016
From Cool and Raw to Hot and Humid
By Russell Russ
This May was about average for weather. This was very unlike the May of 2015 which was near record dry and was far and away the warmest May on record. The month started out cool and cloudy and many days had that early spring raw feel to them. Overcast skies and daily high temperatures only in the 40’s and 50’s gave it almost a March or April feel. It did warm up in mid-month and then towards the last week it really warmed up with hot and humid conditions. The weather conditions went from early spring to mid-summer. Our transition month this year.
May’s low temperature of 33 degrees was observed on May 10 and the high temperature of 89 degrees was observed on May 28. The 89 on May 28 was a record for that date, beating the old daily record of 86 from 2012. With an average monthly temperature of 55.9 degrees it was 1.1 degrees above normal. May 2015 was 61.8 degrees, the first and only time May’s average monthly temperature broke the 60 degree mark.
The total precipitation recorded for the month was 3.85 inches, 0.50 inches below normal. There were three thunderstorms observed this month, but nothing on the severe side. May’s average snowfall amount is 0.4 inch, this May there was just a trace of snowfall, from very light snow showers that occurred on May 15 and 16.
For 2016, January through May, our total precipitation amount is 16.71 inches. This is 3.97 inches below normal. We are below normal for the year so far, but it is not too bad yet and we are in better shape for rainfall than last year. May concluded the winter season for recording seasonal snowfall and the 35.5 inches of snowfall recorded this winter was the least amount on record for winter snowfall. A strange winter for sure.
What will June’s weather bring us? Through mid-month it appears that our rainfall deficit will be increasing. Rainfall continues to be below normal. Temperatures are running just a little below normal, although it has felt much cooler than normal. Breezy conditions June 8 through June 14 certainly contributed to the cooler than normal feel.
April 2016
Springtime Snow and Cold
By Russell Russ
April’s weather was statistically fairly normal. Following a warm February and very warm March one would have almost expected to be swimming in Tobey Pond by mid-April, but that was not the case. April’s temperatures began on a record warm note then quickly cooled off to near record cold in a span of just a few days. The near record cold on April 5 and 6 caused damage to some flowering trees and shrubs. The blooms on forsythia and azaleas were almost nonexistent around town this spring. The spring peepers came out in force on April 1, only to be shocked a couple of days later.
By April 4 we had as much snowfall as we had in December, January and March – combined. And that was less than eight inches. That is unusual for sure. April is usually our big transition into spring month, but this year it seemed to linger in near-spring mode for most of the month.
April’s low temperature of 12 degrees was observed on April 6. The high of 78 degrees was observed on April 22. The April 1 high temperature of 72 degrees was a record for that date, beating the high of 71 set back in 1986. Lows of 13 on April 5 and 12 on April 6 just missed being records by a degree or two. With an average monthly mean temperature of 43.6 degrees, it was just 0.5 degree warmer than average.
The total precipitation recorded for the month was 2.44 inches, 1.81 inches below normal. Through April, our total precipitation for the year was 12.86 inches, 3.47 inches below average. Like last spring we are once again starting to build a rainfall deficit.
April’s snowfall total was 7.8 inches. This was 1.9 inches above normal, but what made it interesting is that it was more snowfall than we recorded in several of our winter months. That explains how poor a winter it was for snowfall around here. For the 2016 calendar year, through April, the snowfall total of 34 inches was 56 inches below normal. The 2015-2016 winter season, October through April, snowfall total of just 35.5 inches was 54.1 inches below normal. It was the least amount of snowfall for a winter season over the last 85 years and possibly much long than that. The old record for least amount of winter snowfall was 40.9 inches from the 1994-1995 season.
If you were hoping for some warmer weather, you will have to wait just a while longer. Through mid-May it was colder than normal. A couple of days reached into the 70’s, but that was followed by light snow flurries on May 15 and 16. On the positive side, the cooler weather does keep the black flies at bay.
March 2016
Record Low Winter Season Snowfall
By Russell Russ
This winter’s unusual and relatively snowless pattern continued through March. Temperatures were well above normal for most of the month. Record warmth on March 9 and 10 cleared the remaining ice from most local lakes and ponds, which was over five weeks earlier than last winter. For outdoor winter sporting activities, it was one of the worst winters in many years. Strangely enough, it was an above average maple syrup season here in Norfolk.
March’s low temperature of 14 degrees was observed on March 5 and the high of 72 degrees was observed on March 9. There were two daily record high temperatures this month. The 72 on March 9 shattered the old record of 63 from 2002 and the 69 on March 10 surpassed the 64 set back in 1977. With an average mean temperature of 38.6 degrees, it was eight degrees warmer than normal and was the fourth warmest March in the last 85 years. The warmest March was in 2012 with an average mean temperature of 41.8. Five of our top 10 warmest Marches have occurred since 2000.
The total precipitation for the month was 2.10 inches. This was 2.35 inches below normal and ranked as the seventh lowest precipitation amount on record for the month of March. Through the first quarter of 2016 the total precipitation amount was 10.42 inches, 1.66 inches below normal.
The monthly snowfall total was just 1.5 inches, 16.2 inches below normal. It was the fifth lowest March snowfall total on record. The snowfall total through the first quarter of 2016 was 26.2 inches, 33.2 inches below normal. There were only two days this month with measureable snowfall and when it came it did not last long. This was vastly different from last March when a snow core taken showed six inches of water being stored on the ground in the form of snow and ice.
This winter season, October through April 15, ranks as the least snowy winter season on record for this station, with a snowfall total of just 35.5 inches. This is 54.1 inches below normal. We still have the end of April and May to go before the season is officially over, but it is looking like we have seen the last of this winter season’s measurable snowfall.
The top three least snowy winter seasons are 2015-2016 with 35.5 inches, 1994-1995 with 40.9 and 1991-1992 with 43.7 inches. It is interesting to note that while 1994-1995 was second least, 1995-1996 ranks as our third snowiest winter. There could be hope for snow lovers—next year.
February 2016
A One Month Winter Season?
By Russell Russ
Winter finally arrived in February, bringing with it a near average amount of snowfall and briefly some very cold temperatures. Unlike last year’s snowy deep freeze of a month, this year gave us just a taste of what normal February weather should be. Even with a brief record cold spell and numerous days with snowfall it was still considerably warmer than normal. It was the twelfth warmest February over the last eighty five years. The early warmth resulted in an early start for the maple syrup season here in Norfolk. For sap flow and maple syrup production it was one of the best Februarys in recent memory.
The month’s low temperature of minus 19 degrees was observed on February 14. This was a record low for that date. It was the coldest Valentine’s Day on record for this station, beating the old 1979 record of minus 15. It was seven degrees colder than last February’s coldest temperature, but this year the real cold weather only lasted for about three days, last year it was cold all month. The high of 59 was observed on February 25. There were two record daily high temperatures this month. The 55 degrees on February 3 beat the 52 from 1991 and the 59 on February 25 tied the record from 1976.
With an average monthly mean temperature of 26.6 degrees it was 4.8 degrees warmer than normal. This February’s average monthly temperature was a whopping 15.7 degrees warmer than last year’s. There were three days with below zero temperatures this month, last year there were nine. This year there were seventeen days with daily temperatures that were above freezing, last year there were just two. What a difference a year makes. Our warmest February was in 2002 when the monthly average was 30.7 degrees. The coldest two months (of any month) on record for this station are February 1934 with 9.0 degrees and February 2015 with 10.9 degrees.
The total precipitation recorded for the month was 6.35 inches, 2.75 inches above normal. The monthly snowfall total of 19.9 inches was just 0.7 inch below normal. It did not seem like it snowed much, but it did. The trouble for the snow lovers this year is that the snow just did not stick around for long. Warm temperatures and several days with heavy rain really put a damper on our snow-on-ground totals this month.
The 2016 calendar year, January and February, snowfall total of 24.7 inches was 17 inches below normal for this period. This was nearly 32 inches less than our January and February total from last year. The snowfall total for this winter season, October through February, is just 26.2 inches. Incredibly, this is 51 inches less than our snowfall total through this period last winter. For comparison, Norfolk’s average winter snowfall total is 90 inches. If the current weather patterns continue into March and April then we could certainly be looking at record low snowfall totals from this winter.
A quick look at early March shows the warmth and lack of snowfall continuing through at least the middle of the month. It appears that our winter may have been extremely short and that spring may be arriving quite early this year. With record warmth recorded on March 9 and 10 it also appears that spring itself may be short lived this year.
January 2016
Winter Weather Still on Hold
By Russell Russ
Unlike our previous two Januarys, January 2016 came and went without much in the way of winter weather. It was warmer than normal and snowfall was well below normal. It just seemed that winter was on hold. Our last two Januarys had above average snowfall and no thaw period, this year except for a few days, we were basically in a constant thaw period.
Most lakes and ponds iced over during the first week of the month. Many smaller ponds iced over on January 4, Tobey iced over on January 6. By the middle of the month the ice was thick enough for ice fisherman. Strangely, Wangum Lake never fully iced over throughout the entire month. Typically the ice on Wangum and Tobey go in and out within a few days of each other, but not this year. It is quite the mystery.
The average mean temperature of 23.9 degrees was 3.2 degrees above normal. It was the warmest January over the last three years, but overall not even in the top fifteen for warmest on record over the last eighty five years. The warmest January on record was in 2002 with an average temperature of 31.7 degrees. The month’s high temperature of 54 degrees was observed on January 10. This was a record high for that date, surpassing the previous January 10 record of 52 set in 1983. The low temperature of 0 degrees was observed on January 5.
January’s total precipitation of 1.97 inches was 2.06 inches below normal. The monthly snowfall total of just 4.8 inches was 16.3 inches below normal. It was the fourth lowest January monthly snowfall total in the last eighty five years. The record for least snowfall for a January is 2.6 inches from 1980.
Winter will have to arrive at some point. It is just a matter of when. A sneak peek at February through the middle of the month shows that it started out warmer than normal, but that was followed by several snowfalls and a record low of minus 19 on February 14. Coldest Valentine’s Day on record. Winter did finally arrive in February. Will it be short-lived this year or will it stick around for a while? As always, stay tuned.
Check out the November/December 2015 weather narrative which includes a summary for the year 2015. To view the November/December 2015 narrative, click on PAST NARRATIVES to the right and scroll down to bottom. The year of 2015 was a strange weather year for sure.
Click on the WEATHER DATA SHEETS listed to the right to see the revised weather breakdowns for this station’s 84-year history.
December 2015
Norfolk’s November & December Weather & a Yearly Summary for 2015
By Russell Russ
Unusual Weather to Finish the Year. The closing months of 2015 brought warm weather and below average amounts of rain and snow. Actually, very warm and very snowless. Unusual for Norfolk, but for 2015 it seemed to be a fitting end to a strange weather year. Numerous months throughout the year ranked high in several categories. Warm temperatures, rainfall deficits and snowfall deficits immediately come to mind, but there were also cold temperatures and snowfall amounts that ranked high in the record books as well. The end of 2015 marks the completion of eighty-four continuous years of daily weather observations at the Norfolk 2SW weather station. This past year will certainly be remembered as being one of the strangest ones in this station’s history.
November’s average temperature of 42.1 degrees was 5.1 degrees above normal and was tied with 1975 as the fourth warmest November on record. The warmest was 2006 with an average temperature of 43.2 degrees. November’s total precipitation amount of 2.40 inches was 2.24 inches below normal. Not record worthy, but it did increase the yearly deficit. Only a trace of snow was observed, 6.5 inches below normal, but not all that unusual.
December was off the charts warm. When you can look at a thermometer in Norfolk on both Christmas Eve and Christmas and the temperature is warmer than it was on Independence Day you know something is strange. The July 4 low was 55 degrees, the high was 67. The high on Christmas Eve was 64 and on Christmas was 58. Needless to say, it was not a white Christmas here this year. Daily high temperature records were set on December 15, 17, 24 and 25. December’s average temperature of 39.5 degrees was 14 degrees above normal. It was by far the warmest December on record, beating the previous December 2001 record by 4.4 degrees.
December did see near normal precipitation with 4.10 inches, just 0.44 inch below normal, but that only included 1.5 inches of snowfall (mostly sleet). That 1.5 inches placed this month tied for third lowest snowfall amount for the month of December. Besides being very warm, this month will be remembered as having much more than its fair share of cloudy days and mist and fog.
The year of 2015 will be remembered as being warm and dry, which it certainly ended up being, but it began very cold and snowy. Last winter started off warm then turned much more winter-like after January. We could possibly see this happening again this winter. The 2015 yearly mean temperature of 46.0 degrees was 1.2 degrees warmer than normal, ranking it as tied with 2007 and 2008 as the twelfth warmest year on record. May, September, November and December were very warm, but January, February and March were quite cold. The crazy warm December was negated by the crazy cold February.
The year’s total precipitation amount of 41.57 inches was 11.22 inches below normal. It was the seventh driest year on record. The snowfall amount of 72.7 inches was 17.8 inches below normal, but thanks to the above normal snowfall in January and February it does not rank very high for least amount of snowfall for a year.
